





















Our investment team is closely monitoring the developments in the Middle East and the impact they are having on commodity prices, the stock market, and the world economy. We lament the loss of innocent life, pray for the safety of U.S. troops in harm’s way and mourn the U.S. military servicemembers who have lost their lives.
You will continue to hear from us on the conflict with Iran. In the meantime, if you have any questions on the markets and the economy or if there is anything we can do to support you and your clients during this difficult time, please reach out to us via our Investment Strategy Team’s email address at opsresearch@orion.com.
Weekly Notes from Tim
By Tim Holland, CFA, Chief Investment Officer
- At Orion, we have a deep appreciation of the power of compounding and the wealth creation capability of risk assets. We also have a deep appreciation of how difficult it is to time the market. So, we focus on the long-term and the fundamental factors that ultimately drive stock prices. That written, sometimes we go through a stretch where markets do better or worse than we would have expected, so our gaze shifts to the near-term as we try and make sense of what markets just did, and why. The past ten days or so seems like one of those stretches.
- While we remain optimistic on the economy and risk assets, we were a bit surprised by the resiliency of stocks in the face of escalating US / Iran hostilities. As we know, on July 7th the US renewed strikes on Iran, claiming Iran had violated the cease fire. Then, on July 13th, the Pentagon announced a shipping blockade of Iran. As expected, stocks fell and oil spiked – at its worst, the S&P 500 was off 1% on the 8th and the 13th, while WTI jumped 4% on the 8th and 10% on the 13th. And then, that was sort of it. Despite its drop on Friday, the S&P is still up half a percent from its July 8th low and off just 2% from its all time high, while oil has moved sideways since July 13th and trades $30 below its 2026 high. So, why have stocks hung in there and why has the price of oil steadied?
- As it concerns US equities, there were a few economic positives to offset the geo-political negative…the June CPI and PPI prints came in cooler than expected last week and Q2 earnings season got off to a strong start, with the big banks beating expectations (if bank earnings are okay most folks on Wall Street think the economy is okay). As it concerns oil, it seems the world is well supplied, at least for now: an estimated 80+ million barrels of Iranian oil made it to market during the cease fire, and OPEC projects a surplus this year. It’s true reserves are down in the US with the Strategic Petroleum Reserve at its lowest since 1983 (see chart), but we are pumping a record 14 million barrels a day, so there is that buffer. Finally, we have been here before as it concerns the US and Iran and a pattern of escalation and deescalation, so Wall Street may be pricing in a pivot to deescalation.
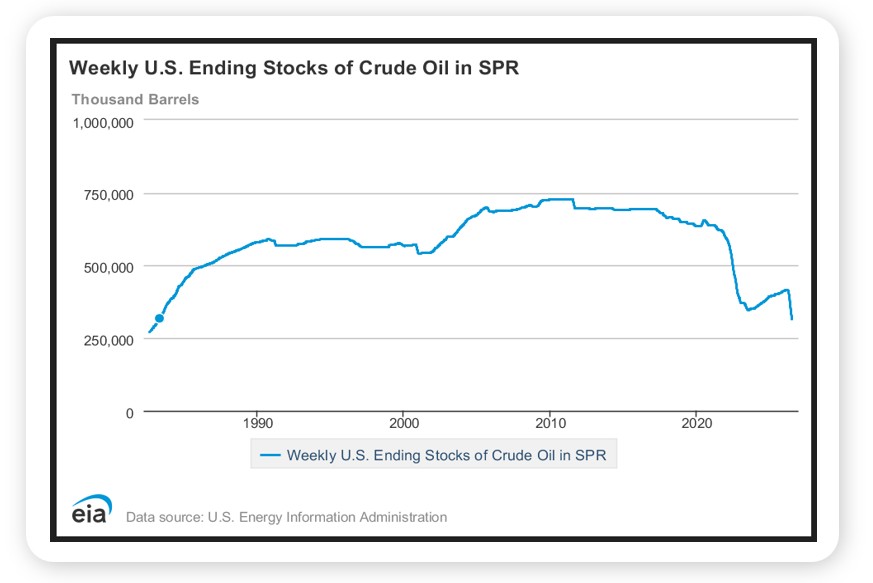
Source, Federal Reserve Bank of St. Louis, July 2026
Looking Back, Looking Ahead
By Ben Vaske, CFA, Manager, Investment Strategy
Last Week
Equity markets gave up ground last week, with the sharpest losses arriving Friday after Chinese startup Moonshot AI released Kimi K3, an open-source model that demonstrated meaningful progress in closing the capability gap with U.S. rivals Anthropic and OpenAI. The release renewed concerns about whether U.S. AI dominance is as durable as equity valuations assume, particularly for hyperscalers whose pricing power depends on a clear competitive moat. The NASDAQ 100 has now lost over 4% in three of the last seven weeks, a notable reversal from the sharp rally that characterized the first two months of the second quarter. Value stocks remain the only positive equity style this month. Bonds provided little diversification, finishing roughly flat on the week and down about half a percent for the month. Oil prices rose again as the Iran conflict re-escalated, lifting the Bloomberg Commodity Index by more than 3%.
CPI declined 0.4% in June, its first monthly drop since April 2020, well below consensus expectations, and the year-over-year reading fell to 3.5%. Core CPI came in unchanged on the month and is now up just 2.6% year-over-year. PPI also surprised to the downside. Together, the reports meaningfully reduced near-term rate hike expectations, though the re-escalation of the Iran conflict keeps the inflation outlook volatile. On a more constructive note, real inflation-adjusted hourly earnings rose 0.8% in June, the largest monthly gain since 2020, and real retail sales finally surpassed their April 2022 peak. Early Q2 earnings results were uniformly strong, with every reporting company beating consensus expectations and blended year-over-year growth now tracking at 24.7%.
This Week
Magnificent 7 earnings season begins this week, with Tesla and Alphabet both reporting alongside IBM and Intel. With 88% of early reporters having beaten EPS estimates, the bar is high but the fundamental backdrop is supportive.
The economic calendar is lighter after last week's inflation-heavy slate, with Leading Economic Indicators and New Home Sales as the primary releases. The July 29th FOMC meeting remains the macro focal point, with markets currently pricing a 66% probability of a hold and a 34% chance of a hike following the cooler inflation data.
We hope you have a great week. If there’s anything we can do to help you, please feel free to reach out to ben.vaske@orion.com or opsresearch@orion.com.