





















Our investment team is closely monitoring the developments in the Middle East and the impact they are having on commodity prices, the stock market, and the world economy. We lament the loss of innocent life, pray for the safety of U.S. troops in harm’s way and mourn the U.S. military servicemembers who have lost their lives.
You will continue to hear from us on the conflict with Iran. In the meantime, if you have any questions on the markets and the economy or if there is anything we can do to support you and your clients during this difficult time, please reach out to us via our Investment Strategy Team’s email address at opsresearch@orion.com.
Weekly Notes from Tim
By Tim Holland, CFA, Chief Investment Officer
- As the war in the Middle East escalates, markets are keenly focused on what higher oil prices might mean for consumer sentiment and spending, inflation and inflation expectations, and monetary policy (as we know, the Fed held rates steady at its July meeting, but higher oil prices is one reason Wall Street expects a quarter point hike at the central bank’s September meeting).
- The attention paid to energy prices is a reminder that for all of America’s economic might we are not fully insulated from the war’s impact on the global economy. That written, we do believe our country’s record oil production – we should pump about 5 billion barrels of crude in 2026 – has meaningfully mitigated the risk premium the war has priced into oil markets, and our country’s record natural gas production – we should produce about 44 billion cubic feet of gas in 2026 – has largely insulated us from the war’s impact on the world’s third most popular source of energy, something which can not be said about countries in Europe and Asia.
- Consider that natural gas in the US is priced at $2.76 per million British Thermal Units, where it was priced when the war with Iran began, while natural gas in Europe and Asia is priced at $18 and $20 per million British Thermal Units, two times where gas was priced when the war with Iran began (see chart; the earlier spike in US prices was driven by a polar vortex, not geo-political events). For context, one million Btu’s generates enough energy to heat a single-family home for two to four days.
- The US is the world’s largest producer of natural gas and has been a net exporter of it since 2017, so we have enjoyed a significant price advantage in natural gas relative to most countries for years (US net exports should hit a record 18.7 billion cubic feet per day in 2026, while five new liquified natural gas export projects should come online in 2027). The war with Iran has brought US energy independence – and the economic benefits of that independence – into very sharp relief.
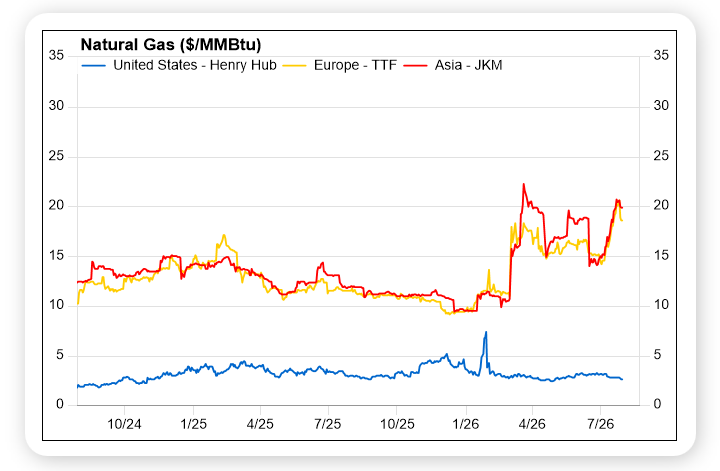
Source: FactSet, July 2026
Looking Back, Looking Ahead
By Ben Vaske, CFA, Manager, Investment Strategy
Last Week
Last week delivered a sharp intraweek reversal. Markets sold off Wednesday after the Fed's July meeting produced its most divided vote in nearly a decade, with three regional presidents dissenting in favor of a rate hike while Warsh held steady and removed all forward guidance from the policy statement. His comment that the Fed's role is to "play the ball, not the referee" signaled a meaningful shift toward reactive rather than preemptive policy, and the 30-year Treasury yield responded by climbing to its highest level since 2007. The curve steepened on the week as short-term rates declined with the hold decision while longer yields moved higher.
The back half of the week was considerably more constructive as Magnificent 7 earnings broadly beat expectations, helping the S&P 500 finish the week up just over 1%. International markets led the way, with emerging markets gaining nearly 2.5% and developed international rising approximately 2%. Value outpaced growth as the rotation away from AI-heavy names continued, and the NASDAQ 100 finished July down nearly 7%, its worst July performance in 22 years, though the index remains up approximately 12% on the year.
On the economic front, Q2 GDP came in at 1.5% annualized growth, below the 2.0% consensus, with the AI and data center buildout accounting for the bulk of expansion. PCE inflation ticked down modestly in June but remains elevated at 3.7% year-over-year. Over the weekend, the U.S. announced it ceased plans for additional strikes on Iran, sending crude oil futures briefly below $80 per barrel, a potentially meaningful development for the inflation outlook heading into the second half of the year.
This Week
Employment data headlines the week, with analysts expecting roughly 85,000 jobs added and the unemployment rate ticking up to 4.3%. With Warsh appearing to lean on the bond market rather than preemptive rate action to combat inflation, labor market data is becoming an increasingly important input to FOMC policy. Markets are currently pricing a 67% probability of a hike at the September 16th meeting, making this week's jobs report consequential.
On the earnings calendar, SpaceX reports for the first time since its IPO on Tuesday after the close, with shares currently trading around $108, nearly 20% below the $135 IPO price. ISM Manufacturing and Services data will also be released this week as investors look for signs of how higher energy costs and the Iran conflict are affecting corporate activity.