





















Our investment team is closely monitoring the developments in the Middle East and the impact they are having on commodity prices, the stock market, and the world economy. We lament the loss of innocent life, pray for the safety of U.S. troops in harm’s way and mourn the U.S. military servicemembers who have lost their lives.
You will continue to hear from us on the conflict with Iran. In the meantime, if you have any questions on the markets and the economy or if there is anything we can do to support you and your clients during this difficult time, please reach out to us via our Investment Strategy Team’s email address at opsresearch@orion.com.
Weekly Notes from Tim
By Tim Holland, CFA, Chief Investment Officer
- If one wanted to be cautious on US equities as 2026 got going, one could point out that stocks were valued at an historically high level – in January, the S&P 500 traded at approximately 26x expected FY1 (Fiscal Year 1) earnings, relative to 10-year and 5-year average price-to-earnings’ ratios of 19x and 20x (to say nothing of a 20-year average P/E ratio of 16x). Of course, as we moved through the year, cautious or bearish investors could cite doubts about private credit and the sustainability of the AI build out, along with the war in the Middle East – and the war’s impact on oil prices – as reasons for believing stocks would be biased lower.
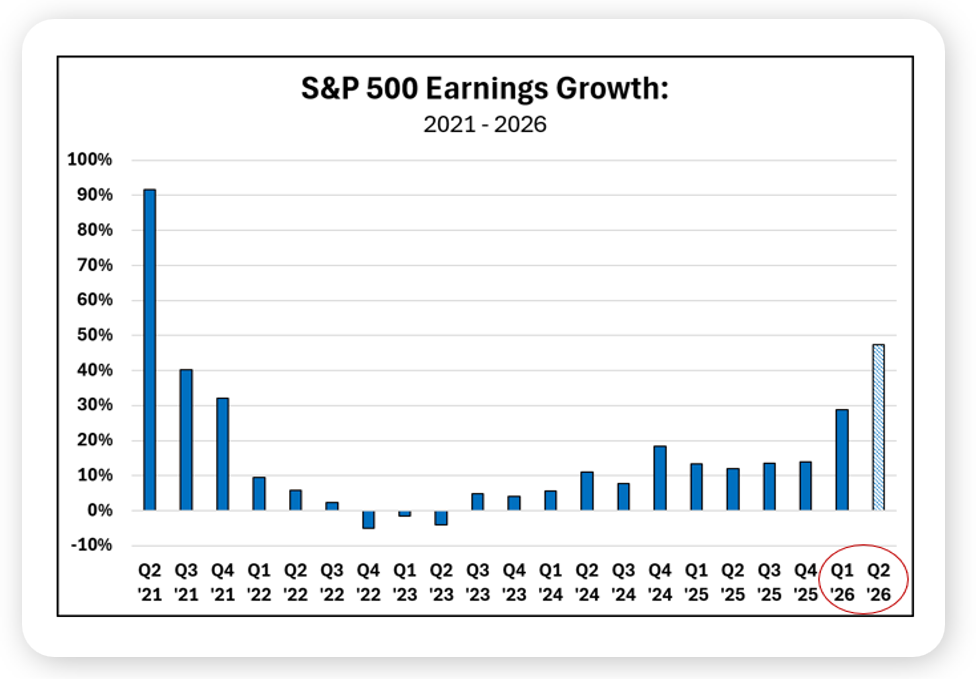
- Yet, despite all those challenges – and at the risk of jinxing it – as we take pen to paper on August 7th, the S&P 500 is just two days removed from its all-time high of 7,794 and is up 12.6% year to date. As to how US equities have been able to remain on the front foot in 2026, we would first and foremost point to growth, specifically growth in corporate earnings. Consider that S&P 500 Q1 earnings grew 29% year on year and Q2 earnings – so far – have grown 48% year on year, well above Wall Street’s expectations and the greatest growth in profits we have seen since the US economy was coming out of the pandemic (see chart).
- And that extraordinary growth has not only helped push stocks higher it has helped address the first point of concern raised in this note, valuation. Despite its near 13% gain in 2026, the S&P 500 now trades at 22x FY1 earnings, down from 26x at the start of the year – we recognize those expected earnings might not be realized, but we will take the combination of share price gains and multiple compression any day of the week. Finally, for those investors who note that a market trading at 22x expected earnings still makes for an expensive market, we would point out that the companies that comprise the S&P 500 are, collectively, more profitable than ever and that a higher level of profitability can justify a higher P/E ratio.
Source: FactSet, July 2026
Looking Back, Looking Ahead
By Ben Vaske, CFA, Manager, Investment Strategy
Last Week
Equity markets delivered their strongest weekly performance since spring, with the S&P 500 and NASDAQ both posting their best weeks since mid-April and early-May, respectively. Gains were broad-based, led by large cap growth and tech names but with meaningful participation from value and small caps as well. The rally was driven by three converging tailwinds: geopolitical deescalation on the Iran front, a softer-than-expected jobs report that reduced rate hike fears, and continued blowout earnings results. Market breadth has improved meaningfully, with 72% of S&P 500 constituents now trading above their 200-day moving average, the strongest reading since late 2024 and a signal that the rally is broadening beyond the handful of mega-cap names that carried the index through much of the past two years. Fixed income had a quietly positive week as Treasury yields pulled lower on the jobs data, with the Bloomberg Agg gaining just over half a percent and high yield adding nearly three-quarters of a percent.
The July employment report was the week's most consequential data point. Nonfarm payrolls declined 23,000 against expectations of 80,000 added, and prior months were revised lower by a combined 103,000. The headline weakness was largely attributable to an unusual 50,000 drop in local government education workers, with private sector payrolls actually increasing on the month. The unemployment rate ticked down to 4.1%, and the report was enough to shift the September rate hike probability meaningfully lower, from 67% to 44%. On the earnings front, Q2 blended year-over-year growth has now surpassed 50% with 88% of companies reported, the strongest quarterly pace since Q2 2021, with all eleven S&P 500 sectors coming in above their estimates from the start of the quarter.
This Week
CPI on Wednesday and PPI on Thursday headline a busy week for economic data, with retail sales also on the calendar. The inflation readings carry added weight given the Fed's September 16th meeting and the shifting rate hike probabilities following Friday's jobs report. On the earnings front, several AI infrastructure names report this week including CoreWeave, Lumentum, Coherent, and Applied Materials, where strong forward guidance could provide a meaningful lift to AI-theme sentiment after a difficult July.