





















Our investment team is closely monitoring the developments in the Middle East and the impact they are having on commodity prices, the stock market, and the world economy. We lament the loss of innocent life, pray for the safety of U.S. troops in harm’s way and mourn the U.S. military servicemembers who have lost their lives.
You will continue to hear from us on the conflict with Iran. In the meantime, if you have any questions on the markets and the economy or if there is anything we can do to support you and your clients during this difficult time, please reach out to us via our Investment Strategy Team’s email address at opsresearch@orion.com.
Weekly Notes from Tim
By Tim Holland, CFA, Chief Investment Officer
- As the mid-terms draw closer, we are increasingly asked if and how the vote might impact the US stock market and economy. First off, nine weeks is an eternity in politics, so a lot could happen between now and then, but our best guess is that the Democrats take the House, and the Republicans hold the Senate, so we end up with a divided Congress and President Trump with two years left in office. And second, while the implications of the vote should be minimal, if history is any guide, a D House, R Senate and an R President would be bullish for US stocks – as would Year 3 of The Presidential Cycle, historically the best year of the four for markets.
- Regardless of who wins in November, and even if there are policy consequences to the vote, there are some things that the US has going for it that won’t change…
- At $32 trillion in GDP, the US remains the world’s largest economy, accounting for about 25% of global GDP
- At $75 trillion, US stock market capitalization accounts for about 50% of global equity capitalization (a huge advantage considering AI funding needs)
- At 60% of foreign reserves, the US dollar remains the world’s reserve currency, with the Euro coming in second at about 20%of reserves
- At 14 million barrels a day, the US remains the world’s largest producer of crude oil, as well as natural gas (a huge advantage considering AI energy needs)
- At $954 billion, the US spends more annually on defense than the next six countries combined, making our military might and reach unmatched
And one other thing that likely won’t change is the partisan lens through which many Americans view the economy…we find the data on consumer sentiment by political party fascinating, particularly going into and coming out of Presidential elections (see chart). At the risk of being bossy, it behooves us all to view economic and market data as it is, not as our political biases might want it to be. Doing so, we think, will lead to better financial outcomes.
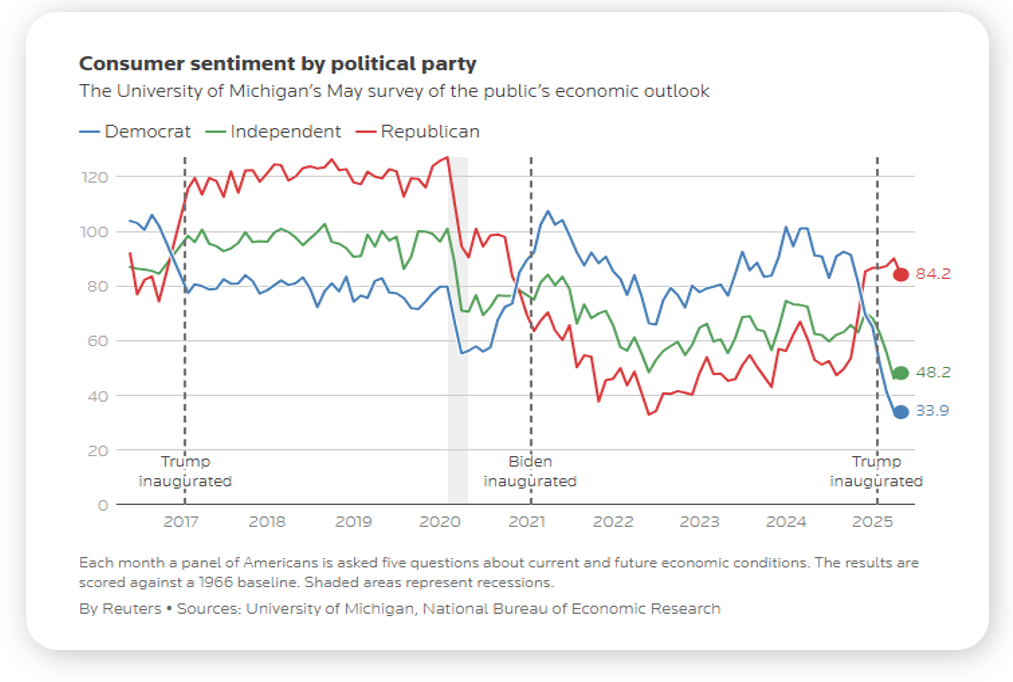
Source: Reuters, 2025
Looking Back, Looking Ahead
By Ben Vaske, CFA, Manager, Investment Strategy
Last Week
It was a week defined by two major events pulling in opposite directions. NVIDIA reported a blowout quarter Wednesday evening, with revenue of $96.2 billion coming in 106% above the prior year and well ahead of the $91 billion consensus, sending tech stocks sharply higher Thursday. By Friday, however, Kevin Warsh's Jackson Hole address had tempered the mood, as he delivered his clearest hawkish signal yet, noting that financial conditions may not be sufficiently restrictive and pushing the probability of a September rate hike from 40% to 57%. The net result was a relatively quiet week for equities overall, with the S&P 500 and NASDAQ each gaining just under half a percent while small and mid caps slipped slightly negative. Value modestly outpaced growth again, continuing the QTD rotation that has become one of the third quarter's most consistent themes. Fixed income was quietly positive across the board, while REITs fell nearly 1.5% as long-end yield pressure continued to weigh on rate-sensitive assets. Emerging markets remain the international standout at nearly 25% year-to-date and nearly 40% over the trailing year.
On the economic front, PCE inflation held steady at 3.7% year-over-year in July, with core PCE at 3.3%, with headline PCE just above expectations and still well above the Fed's 2% target. New home sales declined 10.5% in July, their weakest reading since the start of the year, as mortgage rates sitting roughly 60 basis points above pre-Iran conflict levels continue to sideline potential buyers. A potentially meaningful geopolitical development arrived with news that Iran and Oman reached a preliminary agreement on transit through the Strait of Hormuz, though markets responded cautiously given the conflict's history of short-lived ceasefires.
This Week
Employment data takes center stage this week with the ADP report due Wednesday and the BLS nonfarm payrolls and unemployment rate on Friday ahead of Labor Day weekend. Markets are expecting the unemployment rate to hold at 4.1%. With Warsh's Jackson Hole remarks having shifted rate hike odds to a majority probability for September 16th, this week's jobs data could be the decisive input into the Fed's decision. ISM Manufacturing on Tuesday and ISM Services on Thursday provide the week's early read on economic momentum, with attention on whether the manufacturing sector's recent rebound continues and whether services inflation remains sticky. Broadcom headlines a quiet earnings week as the Q2 reporting season winds to a close.