





















Our investment team is closely monitoring the developments in the Middle East and the impact they are having on commodity prices, the stock market, and the world economy. We lament the loss of innocent life, pray for the safety of U.S. troops in harm’s way and mourn the U.S. military servicemembers who have lost their lives.
You will continue to hear from us on the conflict with Iran. In the meantime, if you have any questions on the markets and the economy or if there is anything we can do to support you and your clients during this difficult time, please reach out to us via our Investment Strategy Team’s email address at opsresearch@orion.com.
Weekly Notes from Tim
By Tim Holland, CFA, Chief Investment Officer
- It has been a tough few weeks for US equities, with the S&P 500, Russell 2000 and Nasdaq Composite off 1.2%, 2.2%, and 1.1% month to date (through 9/10). As to what has pushed prices lower, the primary catalysts seem to be $100 a barrel oil and the increasing expectation the Fed will raise rates by a quarter a point at its September meeting, which concludes Wednesday (on balance, financial markets prefer a lower cost of capital). While not being dismissive of the recent weakness in the markets and the angst it has caused many of us, we think perspective is important…consider that those same indices are up a robust 11%, 17% and 12% year-to-date (through 9/10), and it is that price appreciation – and more specifically what we think has driven it – that is the focus of this week’s note.
- For us, earnings are the reason markets are higher this year – it certainly isn’t the market’s multiple (more on that in a moment). Staying with the S&P 500, 2026 has been a remarkable run for corporate profits, with Q1 and Q2 earnings-per-share up 28% and 52%. And it seems we’re not done yet, with Wall Street forecasting Q3 and Q4 EPS growth of 28% and 26%. That growth has pushed share prices up despite war in the Middle East and worries over inflation and the mid-terms.
- To pivot back to the market’s multiple…while the S&P 500 has gained 11% year-to-date it has done so with no multiple expansion. In fact, the multiple investors are paying for S&P 500 earnings has fallen, with the price-to-earnings ratio for the S&P 500 on a next twelve months basis down from 22x in January to 19x today (see chart below). Were we to experience multiple expansion, were the P/E ratio to return to January’s 22x, the stock market, all things being equal, would probably gain 15%. The catalysts for that multiple expansion would likely be falling inflation and interest rates, which would flatter profitability and make future earnings worth more.
- Finally, Friday marked the 25th anniversary of the September 11, 2001, terrorist attacks. We remember and honor the thousands of Americans who lost their lives, and the first responders who did everything they could to save others on that tragic day.
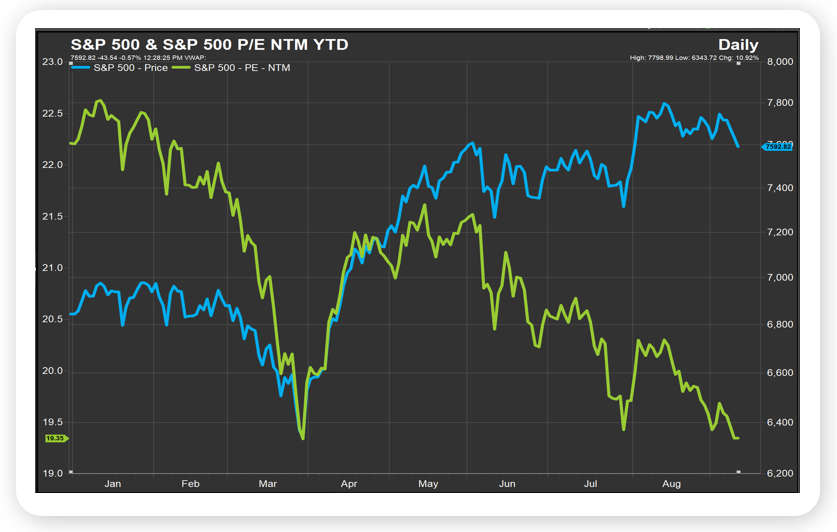
Source: FactSet, September 2026
Looking Back, Looking Ahead
By Ben Vaske, CFA, Manager, Investment Strategy
Last Week
It was a broadly negative week for markets as investors digested multiple headwinds: higher oil prices, surging global yields, and an inflation print that provided no relief on rate hike expectations. The S&P 500 and equities broadly sold off, with small caps bearing the brunt of losses at over 2% on the week, while growth remains the lagging style for the quarter. The 10-year Treasury yield closed the week approaching 5%, its highest level since 2023, after rising nearly 20 basis points in a single week. Commodities once again provided the only meaningful ballast, with the Bloomberg Commodity Index now up nearly 36% year-to-date. The Bloomberg Agg is down well over 1% year-to-date and approaching negative 1% over the trailing 12 months as yields continue to push higher.
August CPI rose 0.4% on the month and 3.4% year-over-year, matching consensus expectations and marking the 65th consecutive month that both headline and core inflation have exceeded the Fed's 2% target. PPI also came in at expectations, up 5.4% over the past year. Together, the reports left the Fed little cover to hold rates steady at this week's meeting, and futures markets have now priced the probability of a hike at 86%. Heading into the week, oil prices are rising again after Saudi Arabia shut down the East-West pipeline following drone strikes, eliminating a key bypass route around the Strait of Hormuz and injecting fresh uncertainty into the commodity and inflation outlook.
This Week
Wednesday's FOMC rate decision is the week's main event, and with an 86% probability of a hike now priced in, the focus will quickly shift to Warsh's press conference and any signals on the forward path given the committee's continued deep divisions. The Bank of England and Bank of Japan are also expected to raise rates this week, underscoring that the inflation challenge remains global in scope. Retail sales round out the week's economic calendar. With over $6 trillion in Treasury debt set to mature within the next 12 months, the bond market's reaction to this week's rate decision and any forward guidance may be as consequential as the decision itself.