





















Our investment team is closely monitoring the developments in the Middle East and the impact they are having on commodity prices, the stock market, and the world economy. We lament the loss of innocent life, pray for the safety of U.S. troops in harm’s way and mourn the U.S. military servicemembers who have lost their lives.
You will continue to hear from us on the conflict with Iran. In the meantime, if you have any questions on the markets and the economy or if there is anything we can do to support you and your clients during this difficult time, please reach out to us via our Investment Strategy Team’s email address at opsresearch@orion.com.
Weekly Notes from Tim
By Tim Holland, CFA, Chief Investment Officer
- Folks in finance are often too academic, too removed from the real world, spending their time trying to understand why a market or economic event happened but not always appreciating the real-world impact of the event itself. That is a dynamic I am aware of as I take pen to paper on this week’s note.
- Bond yields are up, a lot; in fact, on September 23rd the yield on the US 10-Year Note had it biggest single day jump in more than a year and spent most of last week at its highest level since 2007. As we know, there are a lot of theories as to why bond yields have moved higher, with the most reported on being worries over government deficits and debt; sticky and possibly rising inflation and increasing competition for capital as government borrowing needs bump up against AI hyper-scalers’ borrowing needs. The upshot of that jump in bond yields – besides a tough 2026 for traditional fixed income – are higher borrowing costs for American companies and consumers, maybe best represented by a 30-year fixed mortgage rate above 7%.
- We are not dismissive of the above catalysts for higher yields, or the financial pain higher borrowing costs are causing for so many Americans and so many American businesses. That written, we do think there is another reason why bond yields have moved higher and while that will provide no financial relief to Americans and American businesses, it should bode well for the US economy and US fixed income investors on a go forward basis, and that is the rise in real yields.
- To back up, the nominal yield on the US 10-Year Note (the yield we see and investors earn when buying a note) is composed of three parts – 1) real interest rates (the cost of borrowing money before accounting for inflation) 2) inflation expectations (what markets think inflation will average over the coming 10 years) and 3) the term premium (the extra compensation investors require for lending their money out for such a long period of time). What is worth calling out is that the real interest rate component of the nominal yield is at its highest since 2007 at 2.25% (see chart; the real rate – or yield – is calculated by taking the nominal yield and subtracting out expected inflation).
- This is a good thing as it should speak to a US economy that is strengthening – a view supported by better-than-expected jobs and retail sales reports for August and a September S&P Global Composite PMI at its highest level since 2021 – and can handle higher interest rates without being at risk of recession. It also means investors buying the US 10-Year Note today should earn a healthy real rate of return, which is key to maintaining purchasing power over time.
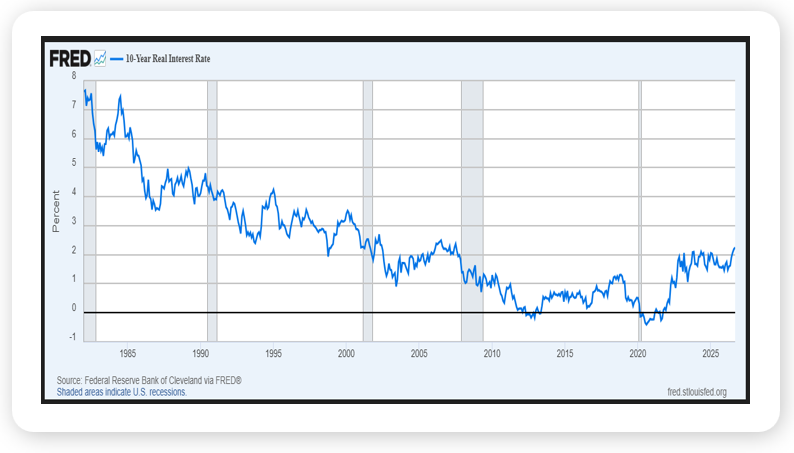
Source: Federal Reserve Bank of St. Louis, September 2026
Looking Back, Looking Ahead
By Ben Vaske, CFA, Manager, Investment Strategy
Last Week
U.S. large cap growth and tech led equity markets higher last week, with the NASDAQ 100 gaining over 3% and the S&P 500 up just over 1%, while value and small caps slipped negative as rising rates continued to weigh on rate-sensitive areas of the market. The U.S. dollar gained over 1% on the week and is now up 3% year-to-date. Despite dollar strength, developed international markets eked out a small gain and emerging markets added over 1%. Fixed income was broadly negative as the 10-year Treasury yield rose nearly 20 basis points to close above 5.20%, its highest level since 2007, leaving the Bloomberg Agg down over 2.5% in September, over 2% year-to-date, and roughly 1% lower over the trailing 12 months. As the third quarter draws to a close, commodities lead all asset classes at over 18% year-to-date, with domestic large caps and value stocks leading equity categories.
The week's most significant development was the continued surge in Treasury yields, driven by a combination of sticky inflation, rising benchmark rate expectations, strong economic growth projections, and heavy bond issuance from both government and corporate issuers. Flash PMIs provided a notably constructive economic read, with manufacturing coming in at 57.0 and services at 58.7, both well ahead of consensus and pointing to expansion at a faster pace than most had anticipated. On a more cautious note, market breadth has continued to deteriorate, with the equal-weighted to market-cap-weighted S&P 500 ratio hitting its third lowest level since 2003 and tracking toward its fourth consecutive annual decline. Yet credit spreads, both investment grade and high yield, remain near historic lows, a signal that the bond market is not pricing in recession or default risk despite the Fed's return to tightening.
This Week
It is a packed final week of the third quarter on the economic calendar. PCE inflation and the nonfarm payrolls report are the marquee releases, with the third revision of Q2 GDP and final manufacturing PMI also on the docket. Several Fed regional bank presidents are scheduled to speak throughout the week, providing additional color ahead of the October 28th FOMC meeting, where markets are currently pricing a 58% probability of another 25 basis point hike. On the earnings calendar, two notable names report at opposite ends of the 2026 performance spectrum: Micron, up 243% year-to-date, and Nike, down 44%.