





















Our investment team is closely monitoring the developments in the Middle East and the impact they are having on commodity prices, the stock market, and the world economy. We lament the loss of innocent life, pray for the safety of U.S. troops in harm’s way and mourn the U.S. military servicemembers who have lost their lives.
You will continue to hear from us on the conflict with Iran. In the meantime, if you have any questions on the markets and the economy or if there is anything we can do to support you and your clients during this difficult time, please reach out to us via our Investment Strategy Team’s email address at opsresearch@orion.com.
Weekly Notes from Tim
By Tim Holland, CFA, Chief Investment Officer
- It has been a bumpy few weeks for equities and for good reason – a war with Iran that seems to be, if not escalating, showing no signs of ending; high oil, gasoline and diesel prices fueling inflation fears and falling consumer sentiment; bond yields at multi-decade highs and the Fed raising rates for the first time since 2023.
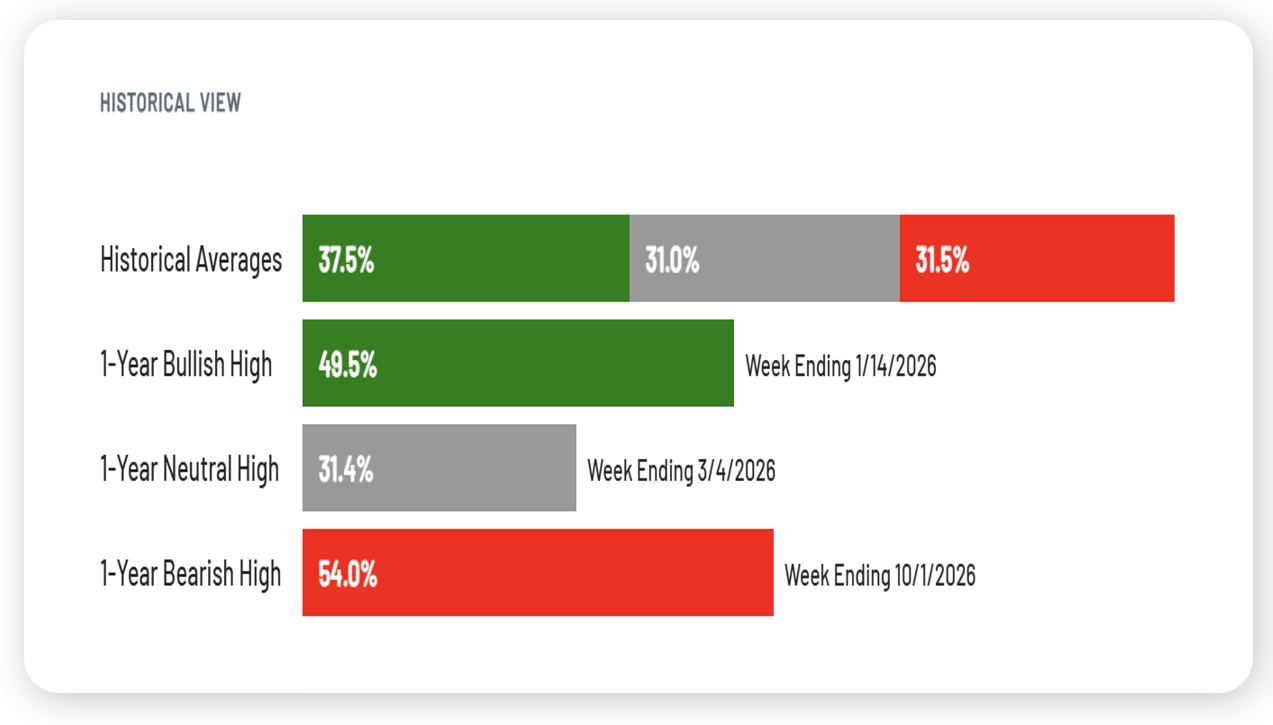
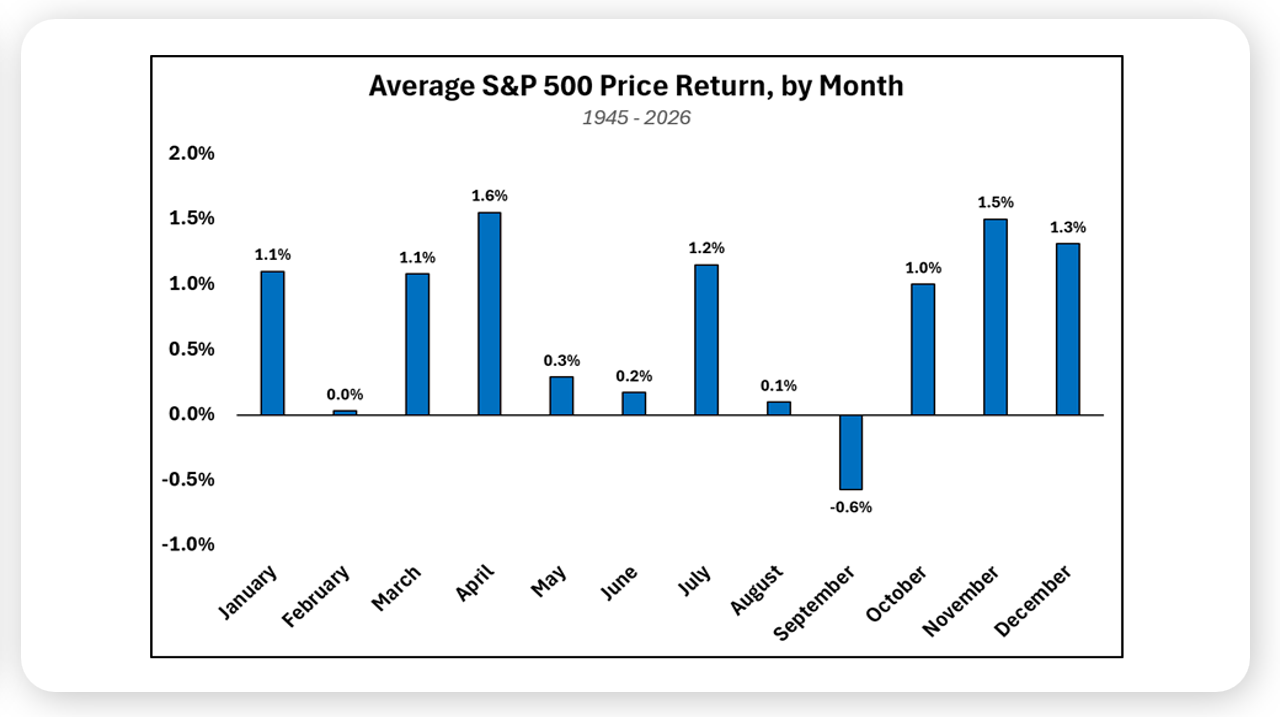
- As an optimist, I try and find the upside in any situation and as it concerns recent market volatility for US equities and a very unpleasant September for some key indices, including the Russell 2000 which fell 5.3% and the Dow Jones Industrial Average which fell 4.1%, it would be the resetting of investor sentiment and seasonality. As it concerns the former, the AAII Investor Sentiment Survey produced a 52-week high in Bearish Sentiment the week ending October 1st (see graph). As we know, investor sentiment, at least on a short-term basis, can serve as a key contrarian indicator – to paraphrase Warren Buffett, we should be fearful when others are greedy and greedy when others are fearful. To put a finer point on sentiment and its historic relationship with future market returns, consider that during the Liberation Day market sell off in early 2025 the AAII Bearish Sentiment reading hit 61.9% the third highest bearish reading in the history of the survey, which dates to 1987; since that reading the S&P 500 is up about 35%. As it concerns typical seasonality, well, we made it through September, the worst month for US equities, and are less than a month away from the seasonally strong stretch of the calendar, November through April (the flip side of Sell In May And Go Away; see chart).
- Other market observers could cite the headwinds called out in the first bullet point above, along with elevated valuations, and historically high investor allocations to equities and historically low allocations to cash, as reasons for caution today, and they would make a compelling case. That written, as we move into Q4, I am looking for reasons to be optimistic about the markets, and I think sentiment and seasonality fit the bill.
Sources: AAII, October 2026; FactSet, October 2026
Looking Back, Looking Ahead
By Ben Vaske, CFA, Manager, Investment Strategy
Last Week
Friday's September jobs report upended what had been shaping up as a quiet week. Nonfarm payrolls came in at just 29,000 and prior months were revised lower by a combined 60,000, resulting in a net job loss of 31,000 including revisions. The unemployment rate ticked up to 4.2%, though notably the labor force participation rate increased on the month, a constructive underlying detail in an otherwise soft headline. Expectations for an October 28th rate hike collapsed from roughly 71% to 22% over the course of the week, and growth equities surged on the repricing. The NASDAQ 100 overcame early-week weakness to finish higher, while other equity styles and sizes rallied Friday but could not fully recover from earlier losses. Bonds fell again, with yields continuing to push higher and the Bloomberg Agg now down nearly 3% year-to-date. Commodities were the week's biggest loser among major asset classes, with WTI crude oil falling over 1% to close near $91 per barrel.
On the economic data front, Q2 GDP was revised higher to 2.2% on the final estimate, well above the prior reading of 1.5% and consensus expectations, with core GDP growing at 4.6%, its fastest pace since 2023. Benchmark revisions to historical data also showed that incomes grew faster, inflation ran lower, and savings rates were higher than previously reported going back to 2021, painting a somewhat more favorable picture of recent economic history. PCE inflation for August came in at 3.4% year-over-year, with core at 3.0%, providing modest relief on the inflation front and further reducing the urgency for additional rate hikes in the near term.
This Week
The fourth quarter begins with a seasonally favorable historical backdrop, as markets have tended to perform well in Q4 when entering the final stretch in positive territory year-to-date. The week's calendar is lighter, with the FOMC minutes from the September meeting due Wednesday as the primary event. Given the Fed's dramatically reduced forward guidance under Warsh, the minutes may offer one of the clearest windows yet into the committee's thinking following its unanimous 12-0 vote to hike. ISM Services data early in the week will also draw attention after the final manufacturing PMI came in slightly below expectations to close the third quarter. Q3 earnings season is picking up steam, with current estimates tracking at 29.5% year-over-year growth, which would mark the third consecutive quarter above 25%.