





















Our investment team is closely monitoring the developments in the Middle East and the impact they are having on commodity prices, the stock market, and the world economy. We lament the loss of innocent life, pray for the safety of U.S. troops in harm’s way and mourn the U.S. military servicemembers who have lost their lives.
You will continue to hear from us on the conflict with Iran. In the meantime, if you have any questions on the markets and the economy or if there is anything we can do to support you and your clients during this difficult time, please reach out to us via our Investment Strategy Team’s email address at opsresearch@orion.com.
Weekly Notes from Tim
By Tim Holland, CFA, Chief Investment Officer
- The big topics of client interest this year have been private credit, and whether stress within the asset class could create recession risk; the war in the Middle East and its impact on corporate and consumer sentiment and commodity prices, particularly oil; the outlook for inflation and how that might influence monetary policy – at the Federal Reserve and central banks globally – and fixed income returns; the mid-terms and how fiscal policy might change post-election and, finally, whether today’s stock market is a rerun of the late 1990s bull market, which as we all now know was a tech, media and telecom fueled bubble that saw major indices hit then all-time highs, then pop and then saw the S&P 500 and Nasdaq Composite fall 49% and 78%.
- And one can understand why some – many – investors see parallels between today’s market and that of 25+ years ago…Wall Street is confronted by a transformative technology whose ultimate impact is unknowable; market leaders are tied to that technology, directly or indirectly, and are disproportionate weights in key benchmarks and thus driving benchmark returns; companies are tapping public markets – both stock and bond – for capital to fund ambitious but unproven spending plans; tech leaders are increasingly funding the activities of partners and clients, and equity indices are near or at all time highs…and to put a finer point on things, the S&P 500 is on pace to produce a fourth consecutive year of double-digit returns, something it last accomplished in the late 1990s.
- That written, we believe today’s market, while exhibiting some of the characteristics of the late 1990s bull market, is not a bubble, and if we had to hang our hat on one datapoint as to why, it would be valuation. Consider that as the S&P 500 gained 110% from 1996 into 2000, its next twelve months price to earnings ratio jumped from 15x to 25x while over the past three years as the S&P 500 gained 65% its NTM P/E ratio dropped from 21x to 19x (see chart). We would argue that meaningful multiple expansion into a rapidly rising market is reflective of investor exuberance and a – likely – stock market bubble, a condition not present today.
- To paraphrase Alan Greenspan, it is difficult to identify a bubble until after the fact; we could be in one, but we don’t believe we are.
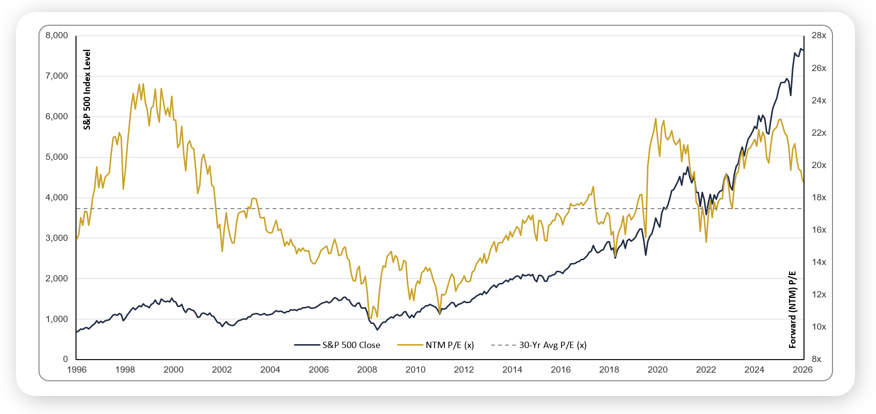
Sources: FactSet, JP Morgan Guide To The Markets, Yardeni Research, October 2026
Looking Back, Looking Ahead
By Ben Vaske, CFA, Manager, Investment Strategy
Last Week
It was a broadly positive but notably mixed week for markets. The S&P 500 gained just over 1%, led by value over growth and large and mid caps over small, though the week contained a sharp intraweek reversal. Both the S&P 500 and NASDAQ 100 hit record highs early before reversing Thursday as AI-related stocks sold off sharply following a report on OpenAI's revenue trajectory, with semiconductors leading the decline before partially recovering Friday. Developed international fell while emerging markets were roughly flat, as the U.S. dollar has strengthened over 3% over the trailing 30 days. Bonds saw a modest rebound as yields retreated from their highs, though the Bloomberg Agg has lost nearly 2% over the last 30 days and remains down about 2.5% year-to-date. The fourth quarter is off to a positive start overall, with mid caps quietly emerging as one of the stronger performers and leading large caps year-to-date.
The week's defining story remained the bond market. The 10-year Treasury yield briefly touched 5.36% on Wednesday, its highest level since April 2002, before a $39 billion 10-year auction at 5.30% helped stabilize the long end and yields pulled back to close near 5.24%. Consumer sentiment fell to 46.3 in the preliminary October reading, below both the prior month and consensus, and Bespoke's MORTGAS misery index, the sum of gas prices and mortgage rates, hit a record high last week, offering a clear explanation for why sentiment readings have remained so depressed even as equity indexes hold near all-time highs. On a more constructive consumer note, credit card borrowing posted its largest monthly drop in nearly two years, suggesting some households are actively reducing revolving debt burdens.
This Week
CPI on Wednesday and PPI on Thursday dominate the economic calendar alongside retail sales and the Fed's Beige Book, which will provide qualitative, anecdotal color on economic conditions across the 12 Federal Reserve districts. With the October 28th FOMC meeting now pricing an 83% probability of a hold, the inflation data is less about the immediate rate decision and more about what it signals for December and beyond. On the earnings front, major U.S. banks and TSMC headline the first meaningful week of Q3 reporting, with current estimates tracking 29.6% year-over-year growth and 84% of early reporters having beaten EPS expectations through the first 19 companies in.