





















Our investment team is closely monitoring the developments in the Middle East and the impact they are having on commodity prices, the stock market, and the world economy. We lament the loss of innocent life, pray for the safety of U.S. troops in harm’s way and mourn the U.S. military servicemembers who have lost their lives.
You will continue to hear from us on the conflict with Iran. In the meantime, if you have any questions on the markets and the economy or if there is anything we can do to support you and your clients during this difficult time, please reach out to us via our Investment Strategy Team’s email address at opsresearch@orion.com.
Weekly Notes from Tim
By Tim Holland, CFA, Chief Investment Officer
- As 2026 got under way, the big concerns on Wall Street were the sustainability of the AI capex cycle; if AI stocks were in or approaching a bubble; and if private credit funds would prove a source of systemic risk for the US economy (and in turn, a meaningful risk to publicly traded risk assets). Recall that private credit funds were confronting rising redemption requests, loan write down and/or loan default risk due to AI potentially disrupting software as a service (SaaS) business models (which are well-represented in private credit funds), and higher borrowing costs that would make refinancing maturing loans a more expensive proposition.
- Before going further, we should acknowledge it can be difficult to analyze the performance of private credit (and private equity, real estate, and infrastructure) funds as they are, well, private, and don’t typically provide daily valuation data. Also, fund valuation is usually determined by a fundamentals- or model-based assessment by the fund’s management team, as opposed to investors landing on the price (or value) of a stock or bond via market-based pricing. Beyond that, the reporting on private credit has focused on managers capping redemption requests—as is their right, and something they would argue is in the best interest of fund shareholders long-term (this “gating” is a reminder one must sacrifice liquidity if one wants to access the robust returns private credit has historically provided).
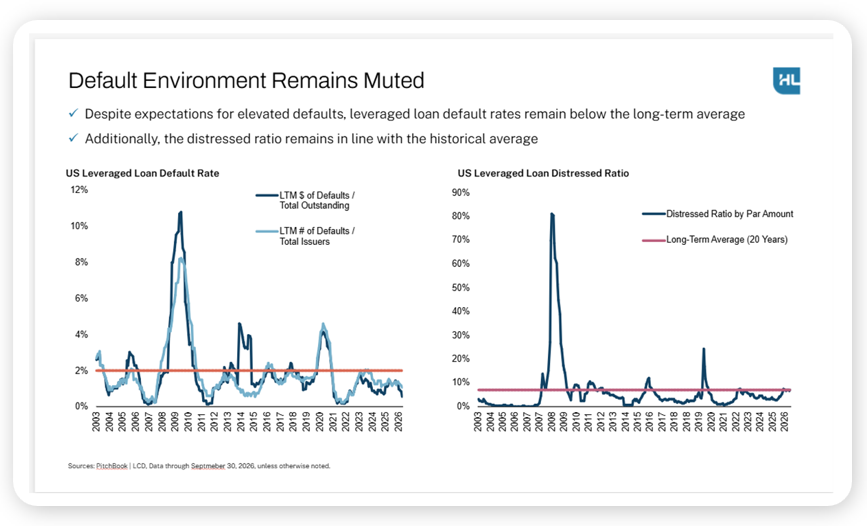
- What we find interesting, and a source of comfort as the world grapples with war in the Middle East, high energy prices, a rate hiking Fed, and the mid-terms, is that private credit has performed solidly in 2026. Not only have leveraged loan default rates and leveraged loan distressed ratios remained below or in line with their long-term averages (see charts below), but the asset class has produced a positive return year-to-date and has outperformed core fixed income and high yield, as of September 30th, per the Morningstar PitchBook US Private Debt Evergreen Index.
- Not all private credits – or loans – and private credit funds are created equal. We expect some number of individual credits to be written down in value or written off entirely and some private credit funds to underperform. Still, the asset class, broadly speaking, has proven resilient in 2026 – aided by a rebound in publicly traded SaaS companies and signs of a strengthening US economy. Wall Street will always have its share of problems. For now, it seems, private credit isn’t proving to be the problem so many investors thought it would be.
Source: Hamilton Lane, October 2026
Looking Back, Looking Ahead
By Ben Vaske, CFA, Manager, Investment Strategy
Last Week
The rotation that has defined the fourth quarter continued last week, with large cap growth and technology stocks losing ground while the more defensive Dow Jones and value stocks outperformed and provided ballast. The 10-year Treasury yield fell back below 5% for the first time in recent weeks, giving rate-sensitive assets a lift as bonds and small caps both posted solid gains. Despite the recent chop, the S&P 500 remains only about 3% from its all-time high. Quarter-to-date, however, the areas that led through the first three quarters have given back meaningful ground: the NASDAQ is off nearly 5%, growth stocks are down over 6%, and emerging markets have fallen over 7%. Bonds have slightly recovered their year-to-date losses, with the Bloomberg Agg up nearly 2% in the fourth quarter.
Beneath the surface, credit markets are telling an increasingly bifurcated story. Investment grade corporate spreads remain near historically tight levels, signaling a benign environment for high-quality borrowers, while CCC-rated high yield debt has seen spreads widen nearly 500 basis points over the last six months, with effective yields reaching 18%, the highest since the pandemic. The divergence suggests the lowest rung of the credit ladder is beginning to feel genuine stress from the higher-for-longer rate environment, even as the broader credit picture remains constructive. On the housing front, starts declined 5.2% in September to their weakest pace of the year, as 30-year mortgage rates now sit around 7.2%, more than 110 basis points above their pre-conflict levels and more than double the rates that prevailed through much of 2021.
This Week
It is one of the busiest weeks of the quarter on both the economic and earnings calendars. The FOMC rate decision Wednesday is the centerpiece, with a 90% probability of a hold priced in, though Warsh’s press conference will be closely watched for any signals on December and beyond. Q3 GDP arrives alongside the decision, with the Atlanta Fed tracking 3.5% growth, and PCE inflation rounds out the week’s data. On the earnings front, Microsoft, Alphabet, Amazon, and Intel all report in what is the peak week of Q3 season, with blended growth currently tracking at 29.5% and nine of eleven sectors running above their September 30th estimates.