Quarter-End Observations · Behavioral Factor: Investor Sentiment · What Does Market Concentration Mean for Stocks?
Portfolio Advice, Talking Points, and Useful Resources
- The second quarter was good for the stock market but not for the average stock.
- Alternatives outperformed core fixed income, and value investing generated strong absolute returns.
- Bullish sentiment on the stock market has surged higher. Typically, this means below-average returns moving forward.
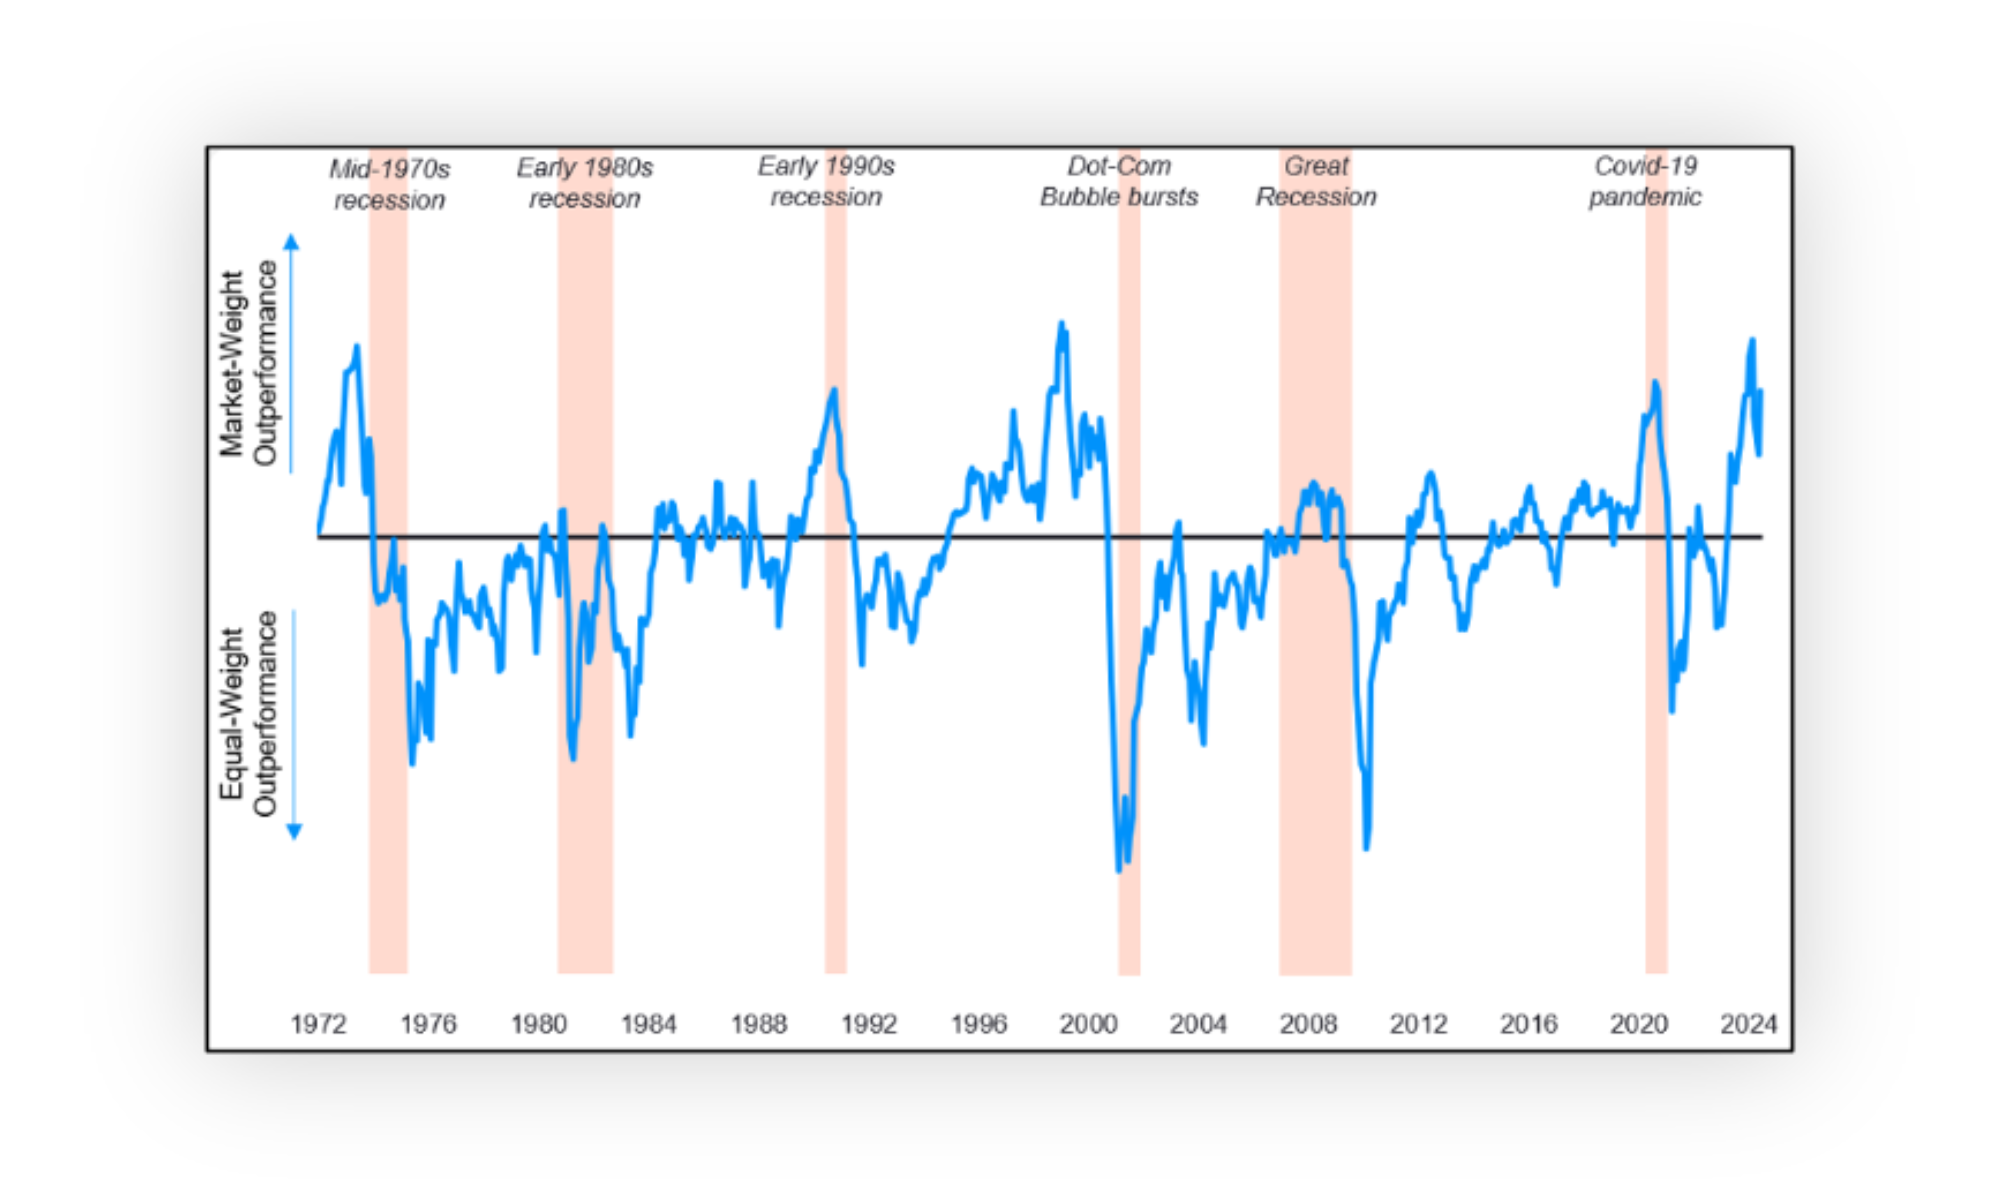
- Stock market performance has become increasingly concentrated. While momentum tends to persist in the short term, it typically leads to below-average performance in the years to follow.
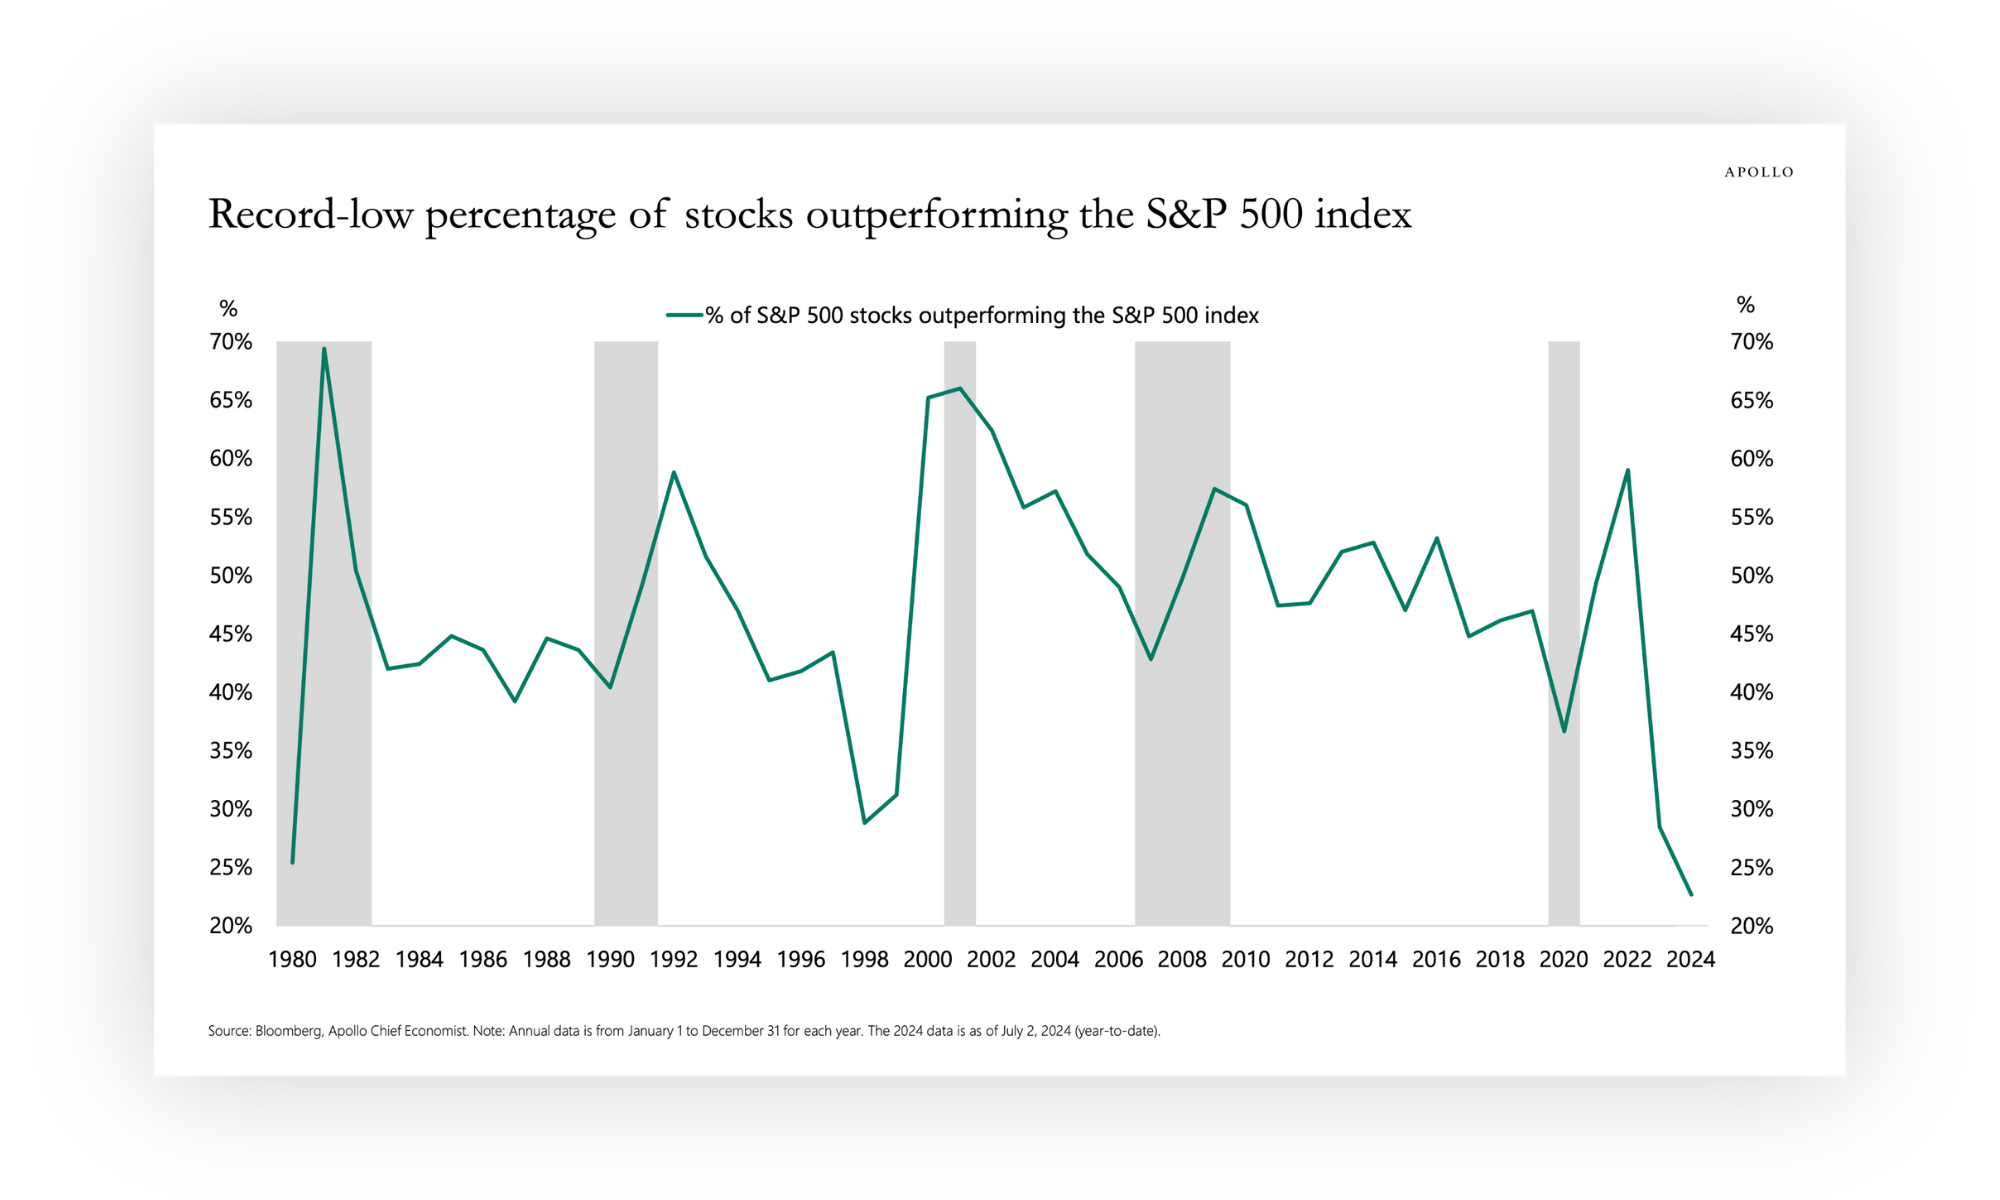
The U.S. stock market (S&P 500) finished another strong quarter, posting a return of more than 4%. The gains, however, were concentrated. Most came from a handful of the largest market-cap stocks, including AI darling, Nvidia. The capitalization-weighted return of the Magnificent Seven stocks was more than 17%, but the average stock lost 3%. Bottom line: It was a good quarter for the benchmark but not for the average stock.
For the remainder of 2024, our outlook remains cautiously optimistic — with a bit more caution than optimism regarding the U.S. stock market. U.S. stocks clearly have encouraging signs, including positive economic momentum, a bullish price trend, and the overall positive liquidity backdrop that accompanies presidential election years. Reasons for caution, however, include the market’s vulnerability due to its concentration, valuations, and overall investor sentiment. We will expand on a few of those factors later in the report.
Interesting Observations from Quarter-End Reports
By Rusty Vanneman
Several items on the performance table from quarter-end might surprise investors.
While the overall bond market eked out a small positive gain last quarter, 10-year Treasury yields rose for the second consecutive quarter, moving from 4.21% to 4.34%. Yields at one point were near 4.75%. Core fixed income, however, posted a slight gain for the quarter thanks to the performance of non-Treasuries, such as corporate bonds and securitized debt. Despite this slight gain, the overall bond market is still down for the year and for the last three- and five-year periods. This is exceedingly rare for the bond market.
The table below from the OPS Quarterly Reference Guide shows how the rarity of negative returns. Reviewing monthly rolling returns since 1926 shows the bond market has generated a loss over a three-year period only 2% of the time and a loss over a five-year period less than 1% of the time.
U.S. Market Historical Return Probabilities
Bond Market Since 1926
| Range of Returns | 1 Year | 3 Year | 5 Year | 10 Year |
|---|---|---|---|---|
| Greater than 20.0% | 2.0% | 0.0% | 0.0% | 0.0% |
| 10.0% to 20.0% | 14.0% | 10.4% | 9.1% | 10.4% |
| 5.0% to 10.0% | 25.5% | 30.8% | 33.6% | 32.4% |
| 0.0% to 5.0% | 46.4% | 56.4% | 57.1% | 57.3% |
| -5.0% to 0.0% | 10.8% | 2.4% | 0.2% | 0.0% |
| -10.0% to -5.0% | 1.2% | 0.0% | 0.0% | 0.0% |
| Less than -10.0% | 0.2% | 0.0% | 0.0% | 0.0% |
Source: IA SBBI Intermediate Term Gov Bond Index, Morningstar. Numbers range 1926 – 3/31/2024. The sum of the figures may be lesser or greater than 100% due to rounding. As of 3/31/2024. Past performance is not a guide to future performance. Individual client accounts may vary.
Nonetheless, we believe the outlook for core fixed income in long-term investment portfolios is positive. Although yields are off their recent highs, core fixed income has had some of its highest nominal yields in decades. Indeed, the best predictor of future returns for bonds is the starting yield. However, depending on credit quality, expected returns for non-Treasury bonds should be trimmed. In addition, relative to equity valuations, high-quality fixed income also looks the most attractive it has in decades. Thus, we believe core fixed income still deserves a role in multi-asset portfolios.
In this expected environment of continued economic volatility and high-equity valuations, we also believe in the use of diversifying asset classes, such as global credit, real assets, and alternatives. Regarding the latter, it is interesting to note that alternatives have outperformed core fixed income in every relevant period going back 10 years. Alternatives, of course, is a large umbrella category with multiple strategies and exposures, but our preference continues to be those with lower volatility that provide diversification benefits for equity-dominated portfolios.
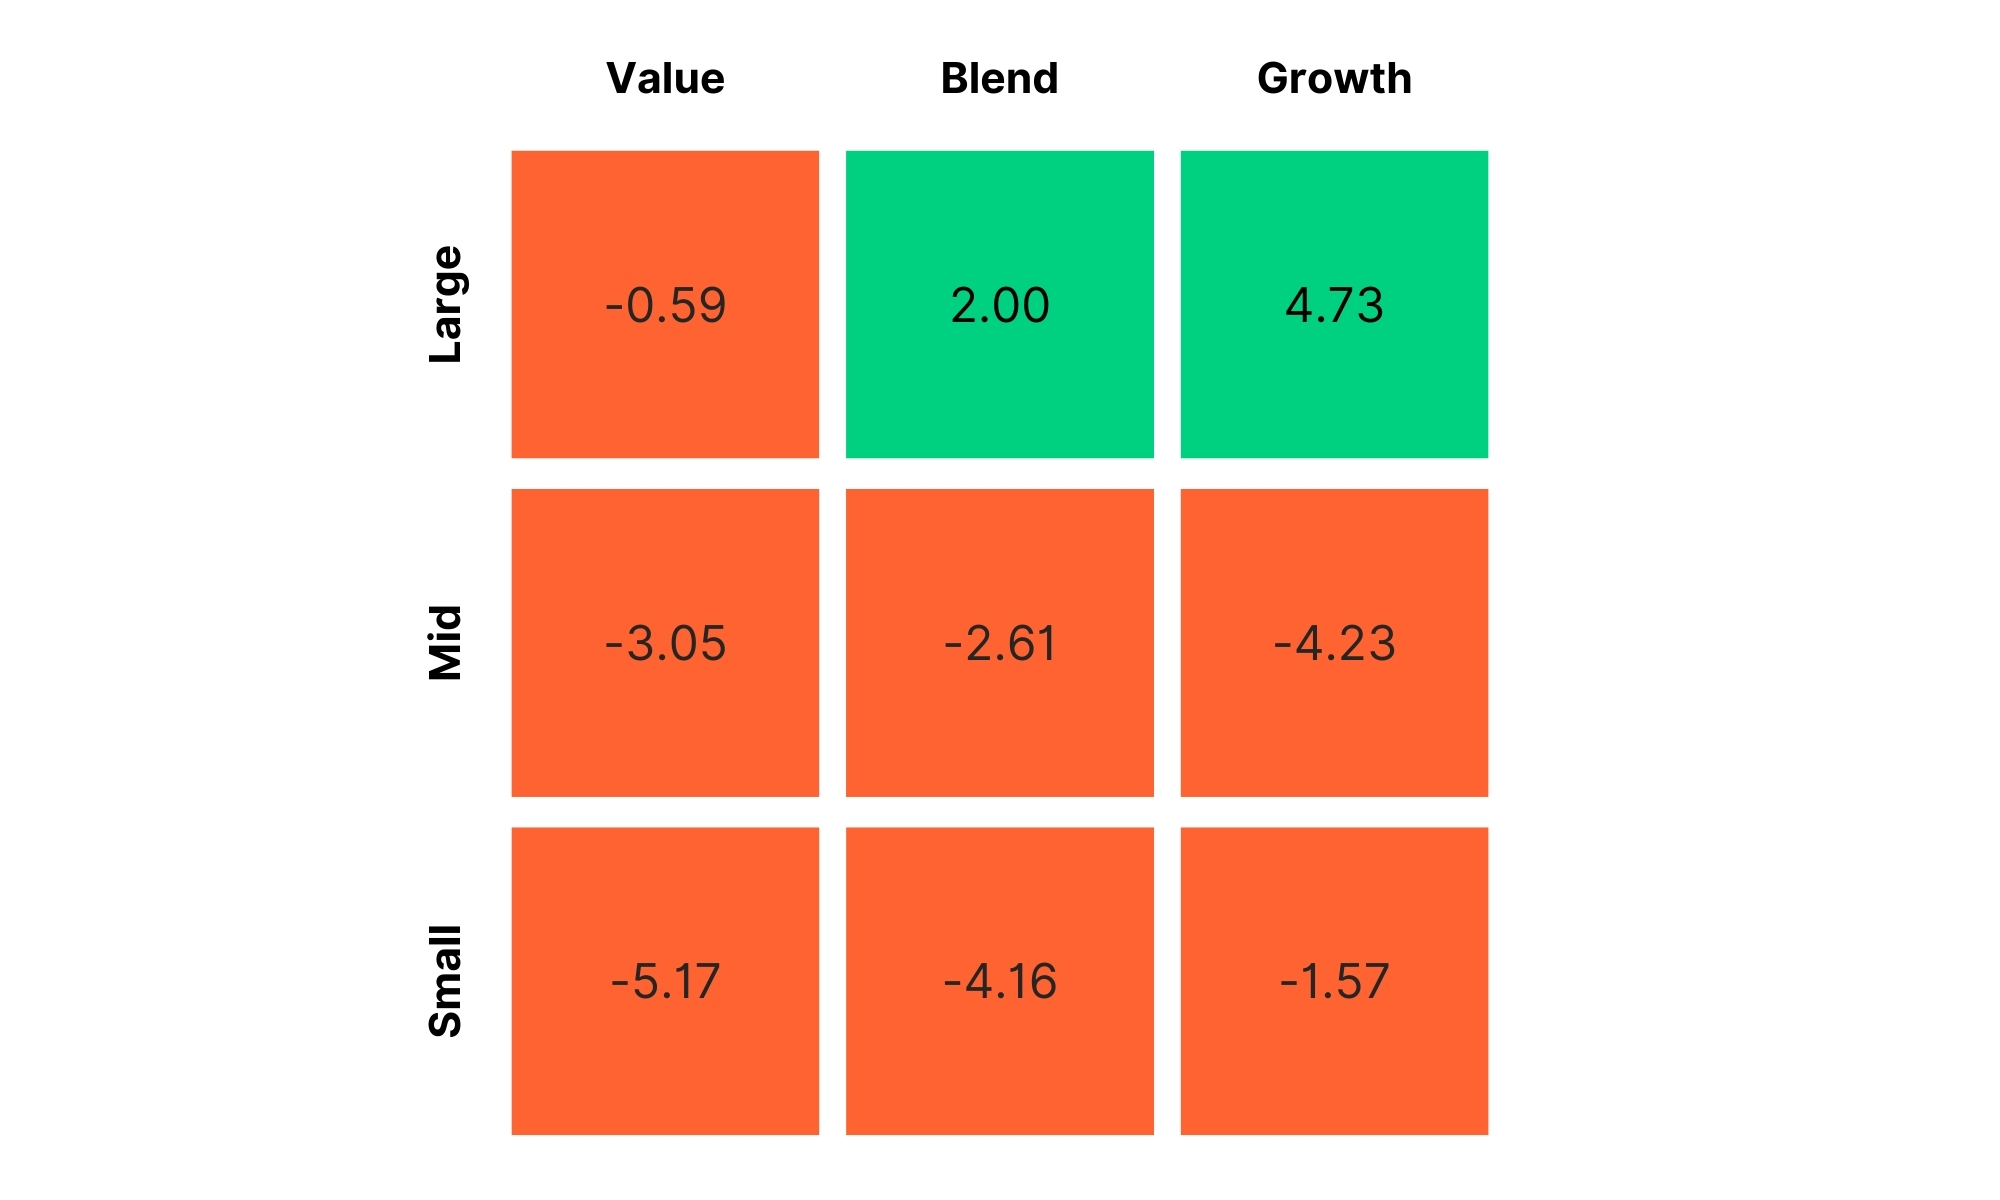
Also surprising for some investors is that value investing has not failed, at least in terms of generating strong absolute returns. Even though in recent years growth stocks (higher growth and higher valuations) have notably outperformed value stocks (lower valuations and lower growth). The Morningstar value index shows annualized returns for value investing over the last one, three, five, 10, and 15 years has been anywhere from +8% to +15%. Returns like those will keep investors on the path toward their investment objectives.
The future of value investing’s relative performance also seems bright. According to the OPS Monthly Chart Pack “Starting Points Matter,” value stocks have traded at an average discount to the overall market of 21% since the beginning of this century, but their current discount is closer to 32%. However, value stocks have traded at an average discount of 46% relative to growth stocks during that time, and their current discount is closer to 64%.
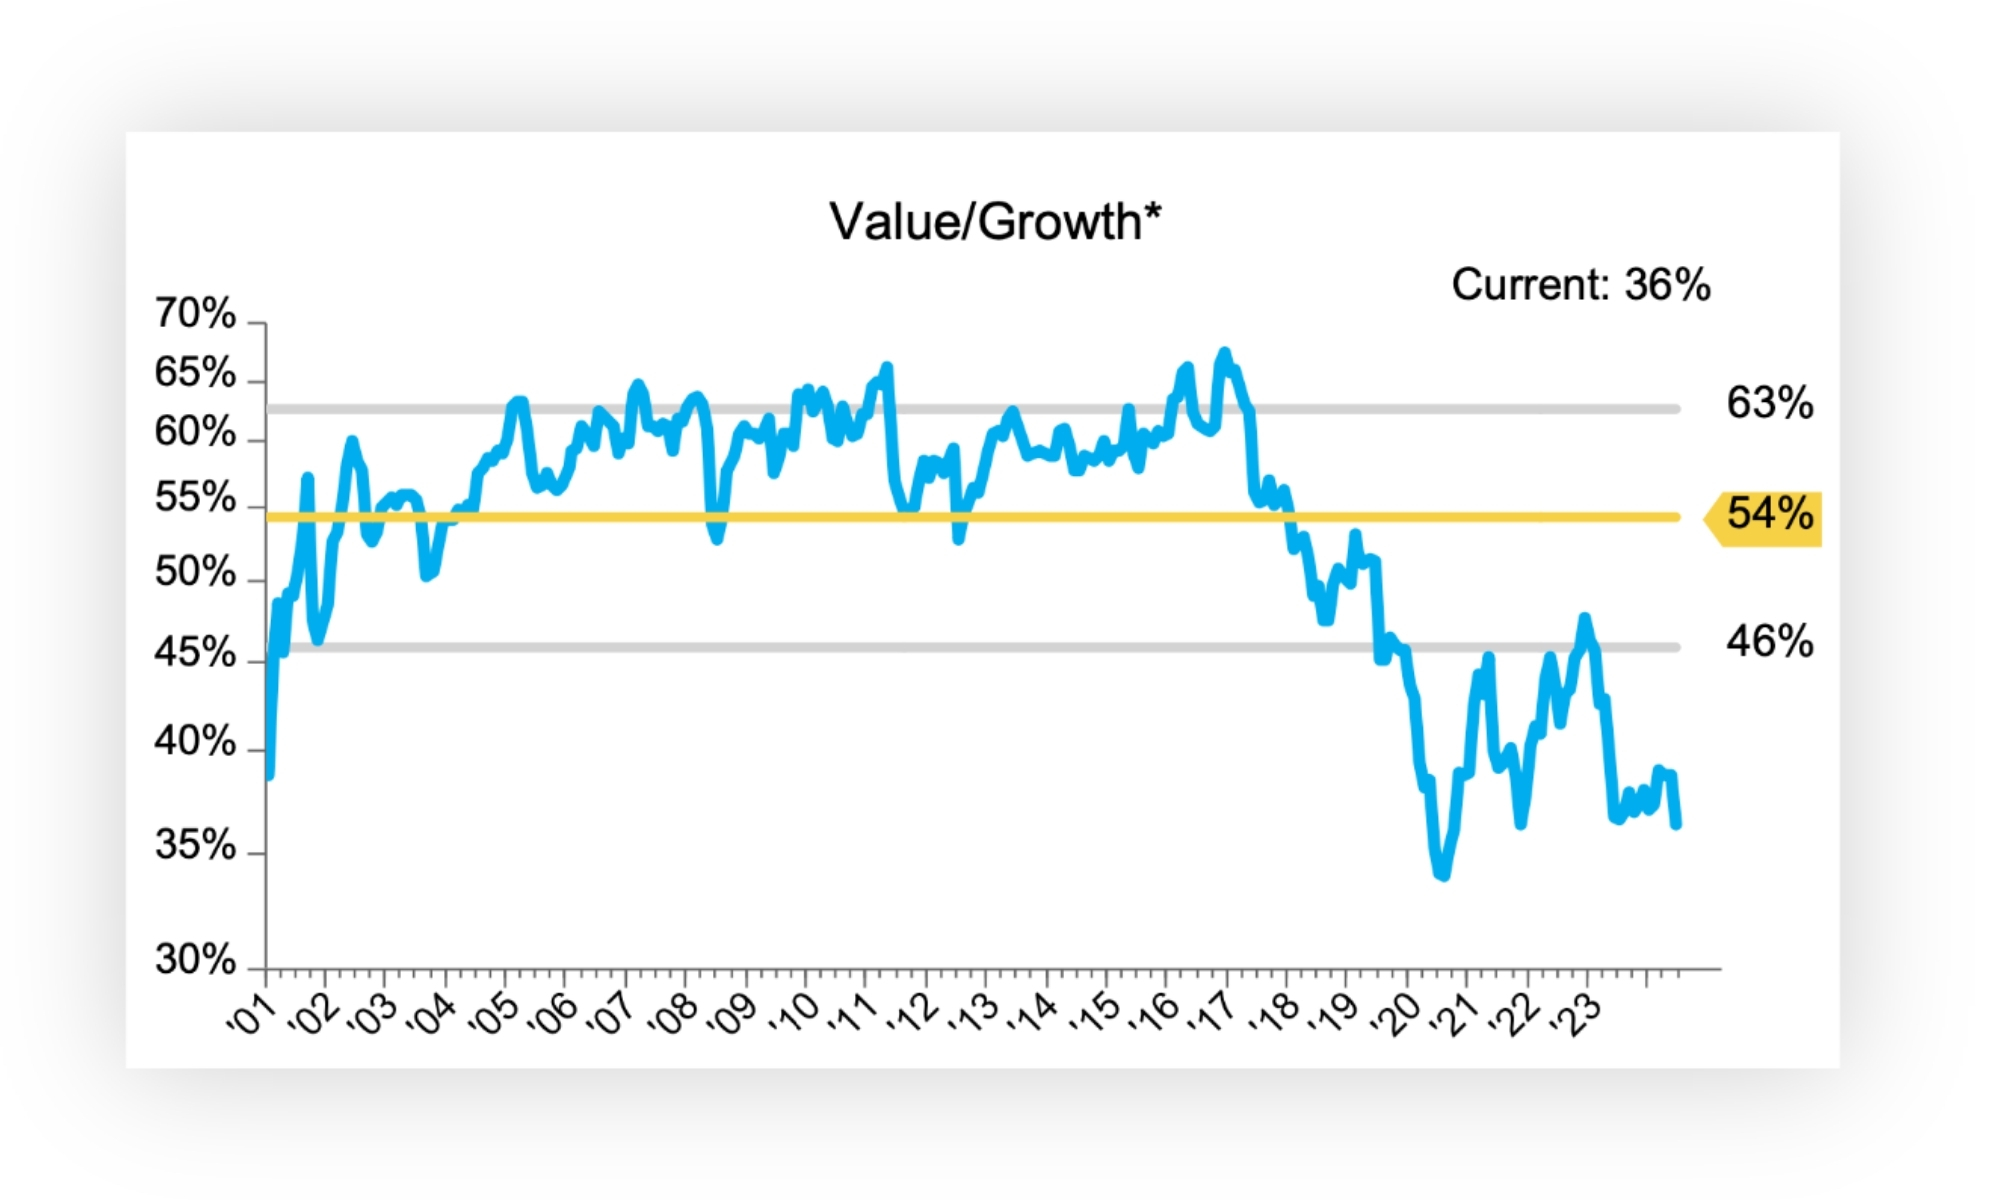
Source: FactSet. *ETFs used where index data is unavailable.
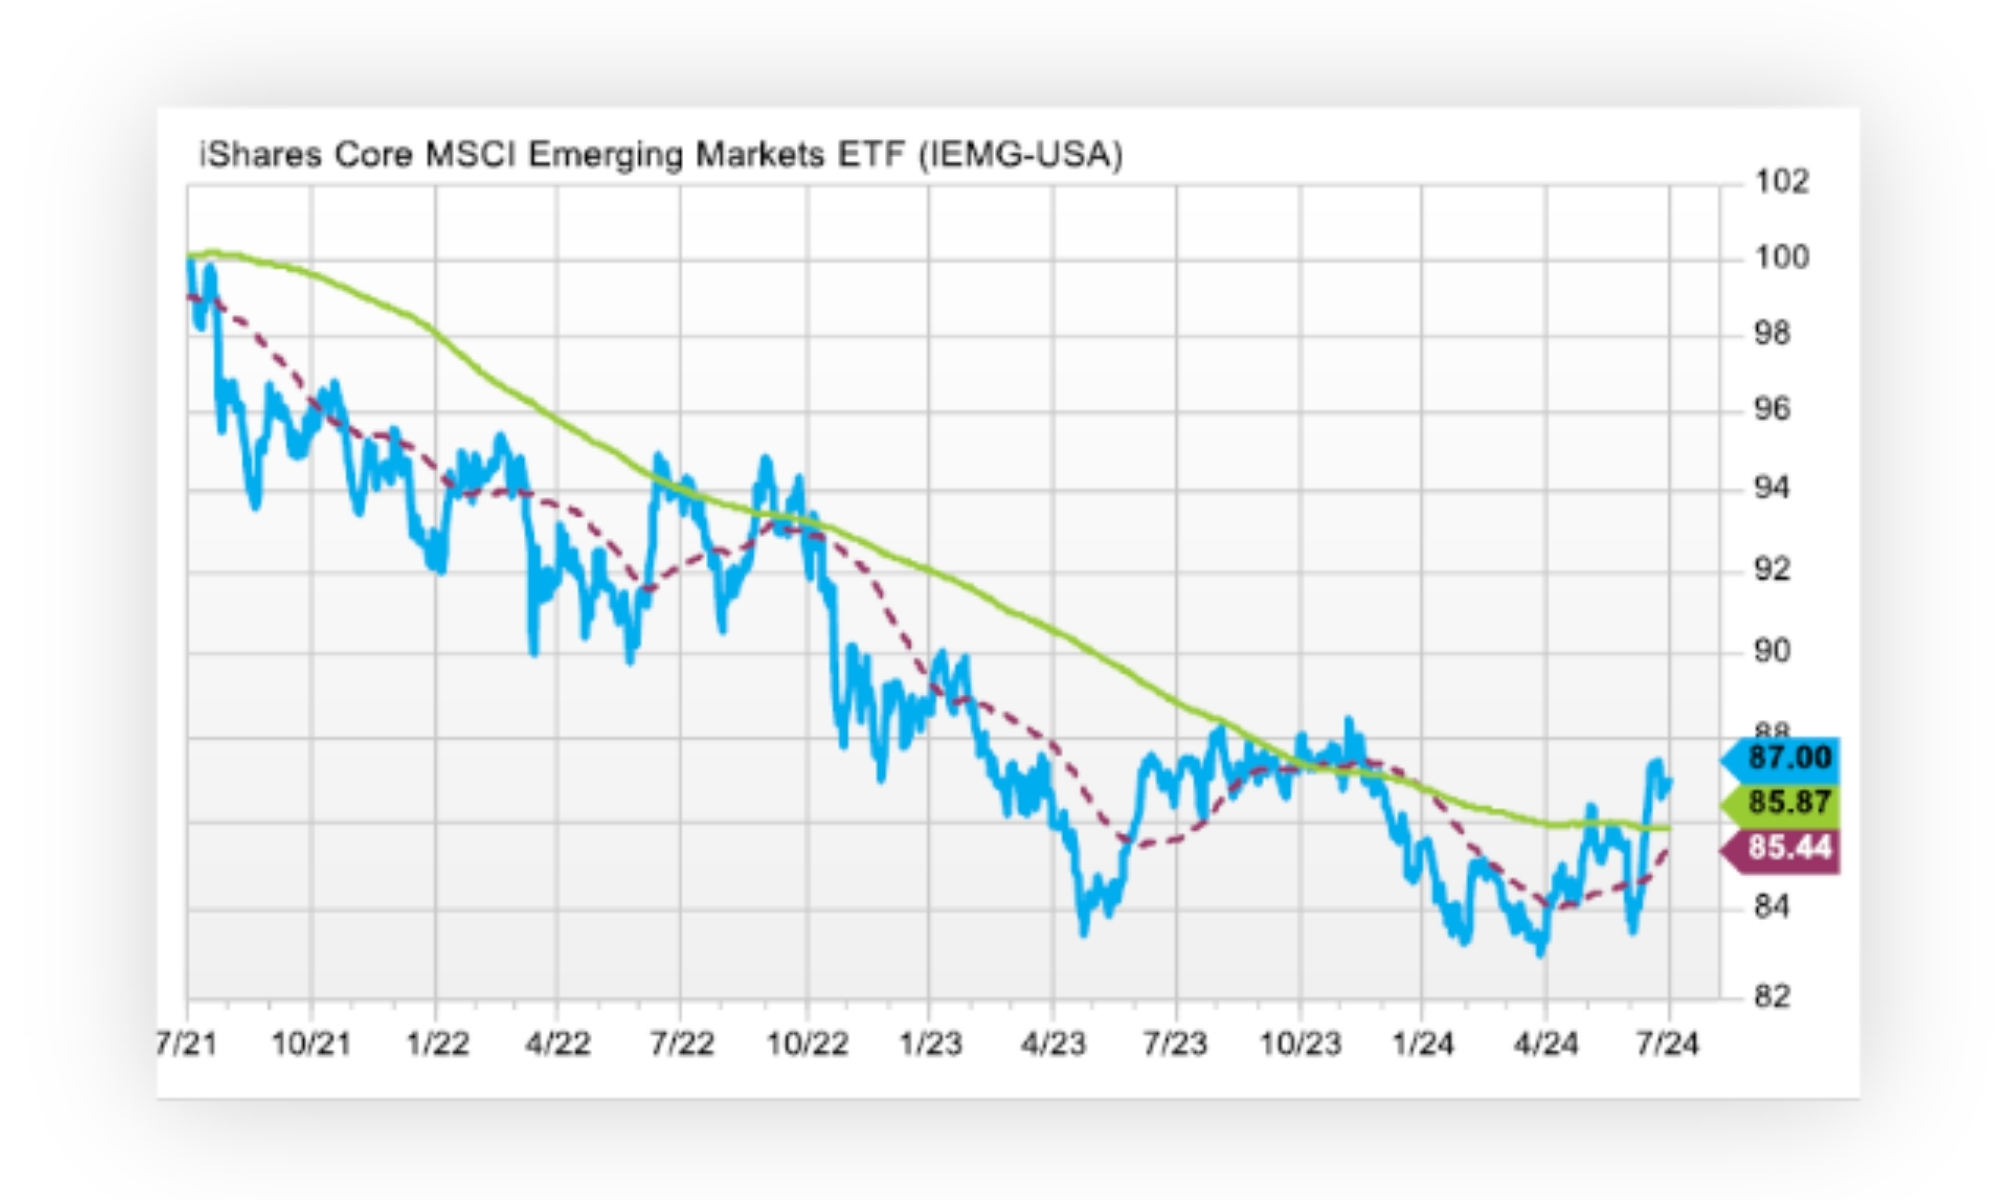
One more interesting question raised from the quarter-end performance reports: Have emerging markets finally turned a corner? Emerging markets outperformed the U.S. stock market last month and last quarter. Even China doubled the U.S. stock market’s return. Emerging markets have had significant relative valuations in their corner for years now, but could this recent outperformance be another false start or the beginning of a sustainable trend?
Below is a chart of emerging markets’ performance relative to the global equity market ex-the U.S. over the last three years. Performance had been relatively poor until early this year, but it has since improved and is above the quarterly (red line) and annual (green line) moving averages.
Source: FactSet.
Reasons for recent gains have been aided by technology, AI-related growth in Asia, and a generally supportive macro environment. On the latter point, inflation overall is not as high as in developed markets, and emerging market balance sheets look healthy. In the absence of rate cuts from the U.S. Federal Reserve, much of the positive performance in emerging markets has been driven by fundamentals and earnings growth. China remains challenging, but valuations and sentiment suggest above-average returns. India continues to show promising earnings prospects, but valuations remain expensive.
The Behavioral Factor: Sentiment-Driven Market Waves
By Ben Vaske
Investor sentiment, market technicals, and the behavioral dynamics of investing play pivotal, though often overlooked, roles in shaping market performance. Recent data from the American Association of Individual Investors (AAII) sentiment survey provides valuable insights into current market conditions and historical contexts, underscoring the profound impact of these behavioral factors on market dynamics.
The latest AAII survey reveals a notable surge in bullish sentiment, marking a new high since its prior peak in March and the largest bull/bear spread recorded in the same period. Furthermore, the number of bearish investors is at its lowest level since February. This wave of optimism is significant, indicating a strong belief in continued market gains despite the maturity of the current bull market, ever-extended valuations in U.S. indexes, and cracks beginning to show in the U.S. economy. It is essential to recognize that current sentiment levels, while elevated, are not unprecedented, but notable market action generally follows sentiment extremes.
On April 14, 2022, sentiment was at its lowest point since 1992, with only 15.8% of investors expressing bullish views. Despite this negativity, the Russell 3000 has since returned 27.2%, and major indices have reached numerous all-time highs. Conversely, the highest bullish sentiment in AAII survey history occurred on January 6, 2000, with 75% of investors bullish. This period coincided with the tech bubble's peak, which burst soon after, leading to a 44% market downturn within three years. When sentiment is excessively bullish, markets can become overheated, increasing the risk of significant corrections. Diversification helps mitigate potential losses during such downturns, providing a crucial risk-management tool.
In addition to sentiment, market technicals such as momentum and breadth are critical components of the behavioral factor. Recent market trends show a pronounced focus on crowded FOMO trades, particularly in AI stocks, with companies like Nvidia and the Magnificent Seven drawing significant investor interest. This concentration on a narrow group of stocks has led to unhealthy market concentration, with the top 10 companies in the S&P 500 comprising nearly 40% of the index. Such concentration increases market vulnerability, as the performance of a few companies disproportionately influences overall market performance.
Momentum indicators reflect this behavioral trend, with strong upward movements in these popular stocks driving broader market gains. However, this momentum can quickly reverse, leading to sharp declines if investor sentiment shifts. Market breadth has also shown signs of steadily narrowing since the bull market began in early 2023, indicating that fewer stocks are driving market gains. This narrowing breadth can be a warning sign of potential market weakness, as a broad-based rally is typically more sustainable than one driven by a handful of stocks.
The interplay between sentiment, momentum, and breadth forms a complex behavioral landscape that requires investors to analyze their current positioning and recognize their potential biases. While positive sentiment and strong momentum can drive markets higher, they also bring the risk of speculative bubbles and increased volatility. Conversely, negative sentiment and declining breadth can create buying opportunities for contrarian investors willing to capitalize on undervalued assets.
Elevated bullish sentiment, continued momentum in crowded trades, and narrowing market breadth signal both opportunities and risks for investors. Staying invested and diversified remain essential strategies for navigating the ever-changing market landscape, and behavioral factors are a critical component of the equation.