A common refrain amongst the investment community is that with central banks moving to cut rates, inflation must be tamed and economic strength is the new concern. In such an environment, it makes sense to move up in quality within corporate bonds because you will be more exposed to bonds that are more interest rate sensitive and less exposed to credit sensitive assets.

We do not disagree with the central premise of this argument. Where we think it falls down is when it is applied simplistically. One could quite easily have assembled a convincing case for an impending recession in the past 24 months – inverted yield curves, weak purchasing manager indices, subdued consumer confidence – and avoided high yield bonds in their entirety. To do so would have been costly as global high yield bonds, represented by the ICE Global High Yield Bond Index, delivered a total return in US dollars of 31.9% over the 24 months to 30 September 2024.1

Woman looking at tablet
Orion Advisor Academy

Misunderstood and Unconvinced

Sign up today to earn FREE CE with Janus Henderson's course about how to successfully engage female investors.

Start Learning Today

New to OAA? Use Key Name "OrionAdvisorAcademy" to sign up.

High yields offer a head start

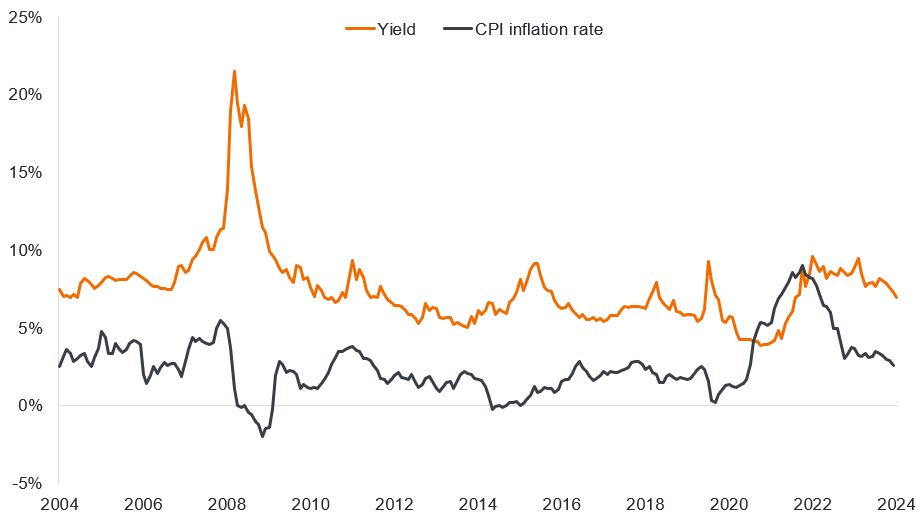
Part of that strong return has come from capital gain, but nearly 60% came from income. Time and again, throughout history, it is income that typically drives the long-term returns on assets. Today, US high yield is yielding approximately 7.0% and European high yield 5.8%.2 These are not the most generous yields, but they are not mean either and certainly not in the context of current inflation levels. A cursory glance at the yield on US high yield versus US inflation (headline Consumer Price Index) suggests that current yield levels are about standard for the last 20 years outside the spikes that occur in crises.

Figure 1: Yield on US high yield bonds versus US inflation

A chart showing the line for the yield on US high yield bonds in orange and for the US inflation rate in grey. The yield is typically a few percentage points higher than inflation and is so currently, with the yield at 7% and inflation at 2.6%.

Source: LSEG Datastream, ICE BofA US High Yield Index, yield to worst, Bureau of Labor Statistics, US Consumer Price Index (CPI) inflation rate, year-on year percentage change, seasonally adjusted, 30 September 2004 to 30 September 2024. Yield to worst is the lowest yield a bond (index) can achieve provided the issuer(s) does not default; it takes into account special features such as call options (that give issuers the right to call back, or redeem, a bond at a specified date). Yields may vary over time and are not guaranteed.

Spreads tight but could they go tighter?

It is at the credit spread level that valuations on high yield bonds look rich but just because they are at the tighter (or low) end of their range does not mean they cannot go tighter. As a reminder, the credit spread is the difference in yield between a corporate bond and the equivalent government bond. It is essentially the part of a corporate bond’s yield that reflects the additional compensation investors want to be paid to take on the risk of lending to that company. A soft landing is the type of environment that could allow credit spreads to tighten further, since moderate economic growth should allow cashflows to be maintained and reduces the risk that central banks would revert to raising interest rates again.

Spreads widen when investors demand greater compensation to own bonds. Right now, tight spreads are the market’s way of signalling that investors are reasonably comfortable to accept credit risk (the risk that a corporate borrower is unable to meet their debt repayments). This is evident in bond issuance where the supply of corporate bonds has been met by plenty of demand from investors. In the first nine months of 2024, companies have issued €74billion in non-financial high yield bonds in Europe, up 97% on the same period last year, while in the US some US$235 billion has been issued, up 74%.3 Companies can access markets, and this is helping to keep the default rate relatively low considering we have just come through a tightening cycle.

Spread levels can be thought of as compensation for fundamental risk (risk to corporate cash flows coming either from wider economic growth factors or factors unique to that company) and liquidity risk (ability for a company to refinance, typically influenced by supply/demand for bonds and the environment fostered by central banks).

On the fundamental side, we are getting mixed data. US economic data has been resilient but European purchasing manager indices – which indicate business activity levels – have been moribund.

On the liquidity side, on both sides of the Atlantic, interest rates are coming down. In the US, the most recent figures for the US Federal Reserve’s (Fed’s) preferred inflation measure (Personal Consumption Expenditures) was at 2.2% year-on-year for August 2024 at the headline level (2.7% at the core level that excludes volatile food and energy prices).4 This is close to the Fed’s 2% inflation target, providing the Fed with flexibility to cut rates aggressively if the economy weakens. The Fed’s 50 basis point interest rate cut in September was proof that the Fed is keen to be pro-active in tackling any economic deterioration. With the rate cutting cycle underway, pressure on interest coverage ratios diminishes.

Within Europe, we are seeing a growing proportion of high yield issuers opting for floating rate notes. These are bonds that come with an interest rate that changes (floats) rather than a fixed coupon. The benefit to the issuer is that the rate should fall as central banks cut policy rates. This would allow for a faster transmission of looser monetary policy, and with the European Central Bank considering bringing forward rate cuts the impact could be felt even earlier.

Figure 2: European high yield non-financial senior supply (EUR billion)

A chart showing two lines in billions of euros, one for fixed coupon bond issuance, the other for floating rate bond issuance over the past 12 years. The fixed line has jumped up sharply from last year but is running at average levels. The floating rate issuance in contrast is running at its highest level, at almost 20 billion euros, double the level for any other year.

Source: Bond radar, Morgan Stanley Research, issuance over last 12 months, September 2012 to September 2024.

Positive re-rating

We said at the beginning that high yield bonds are not universally loved. Investors see attractions from the yield but are wary about tight spread levels. Part of this reflects a preference for rate sensitive assets over credit as well as some de-risking ahead of the US election. In our view, this is good. If favouring high yield over investment grade was popular then the asset class would be more vulnerable to sell-offs. As things stand, high yield is in the bucket that asset allocators view with caution.

The same could have been said about Chinese equities until last month. Chinese equities jumped more than 20% in a matter of days in late September in response to stimulus announcements from the Chinese authorities.5

Something similar has happened within high yield bonds issued by telecommunication (telco) companies. In the past few weeks we have seen merger and acquisition activity in the telcos market, with Verizon bidding for Frontier Communications – a company that essentially reunites Verizon with some of the fibre network assets it sold back in 2017. The pending deal is positive for Frontier bonds that are expected to be refinanced by Verizon, which has a stronger credit rating. Meanwhile within media, DIRECTV has bid for EchoStar’s video distribution business DISH. Concurrently, AT&T is selling its 70% holding in DIRECTV to release money partly to reinvest in fibre connectivity.

The merger and acquisition activity has the potential to create synergies and reduce costs but we think some of this re-rating can be linked to the theme of artificial intelligence (AI) and the increased need for data transfer. Fibre networks are being revalued as a useful transmission tool. What this means is that a high yield company such as fibre network business Lumen, which over-expanded and over-levered its balance sheet, in our view now has considerable growth potential because it has the hard assets of a global fibre network in place.

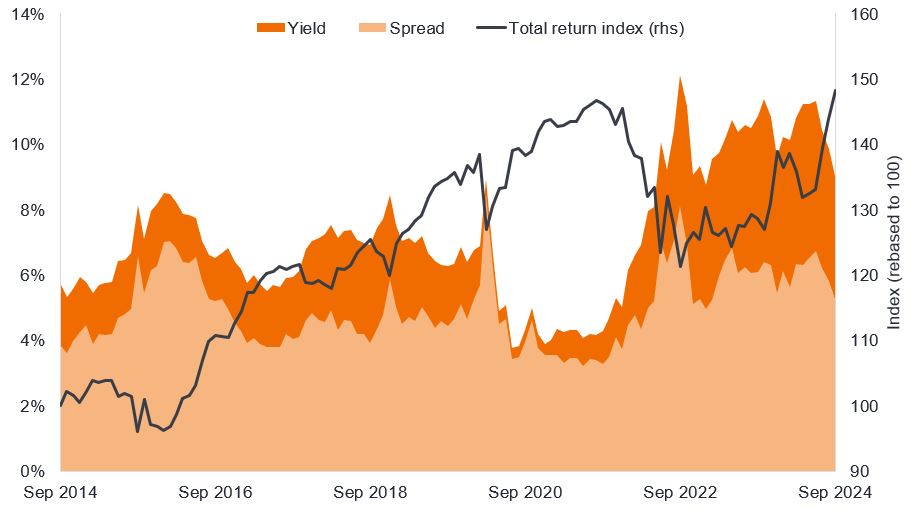
Whether it is consolidation or a re-evaluation of assets in a business, we are seeing market sentiment towards telco assets, particularly those with fibre businesses, turn more favourable and that has caused spreads to come down and bond prices to rise as yields have fallen sharply in the sector. Over the course of the third quarter of 2024 alone, the telecoms sector of the US high yield market returned 11%.6 Yet yields and spreads remain elevated, which could offer the prospect for further gains.

Figure 3: US high yield telecom sector has performed strongly in recent months

A chart which shows the yield (%) on US telecommunications bonds and the spread as a portion of that yield for the past 10 years. Currently, there is quite a high yield and spread for bonds in this sector, especially compared with three years ago. The chart also plots the total return index for the sector. This rose fairly steadily until late 2021 when it began to fall. It has since recovered and particularly so in the most recent couple of months.

Source: Bloomberg, ICE BofA US High Yield Telecommunications Index, yield to worst, option adjusted spread over governments, total return index in US dollars, September 2014 to September 2024. Yields may vary and are not guaranteed. Past performance does not predict future returns.

Due diligence

Taken together, we think the cautious attitude towards high yield may be misplaced and (putting geopolitics aside) the positive run in high yield can continue so long as the US economy holds up. That does not mean being complacent. We need to be mindful that idiosyncratic risk is ever present and high yield bonds are rated lower quality for a reason. Challenges exist. These challenges can and are being dealt with, which explains the relatively low default rates experienced during the most recent tightening cycle.

Yet we also need to recognise that some bonds will struggle. Among bonds rated CCC, the amount of cash available to cover debt costs is low, with many companies actively burning cash. They can cut capital expenditure (capex) to free up cash to some extent, but even this has negative implications as one company’s saving on capex is another company’s lost revenue.

The tightness in spreads means little room for disappointment so earnings results alongside economic data will command particular importance. For now, economic data continues to point to a soft landing and central bank rate cuts should help to bring down bond yields. High yield bonds typically have shorter maturities than investment grade bonds on average, so a decline in the front end of the yield curve has the potential to help boost total returns and cut refinancing costs.

So far, rate cuts have been in response to falling inflation and as a precautionary measure to ward off economic softness. Provided that remains the case, we think high yield continues to offer attractions within a diversified portfolio.

Experience Orion and Janus Henderson Together

Expand your offering and unlock new opportunities with direct access to Janus Henderson’s investment expertise, integrated seamlessly into Orion’s platform.

Learn More

About the Author

Brent Olson, Portfolio Manager at Janus Henderson Investors

Brent Olson is a Portfolio Manager at Janus Henderson Investors on the US Fixed Income and Corporate Credit Teams, a role he has held since 2019. Brent rejoined Janus Henderson in 2017 as a credit analyst. Prior to this, he was a lead portfolio manager at Scout Investments on a growth equity strategy that emphasized fixed income metrics and credit data points to select stocks. Before Scout, he oversaw high-yield and leveraged equity research as well as managed fixed income products at Three Peaks Capital Management from 2005 until 2013. From 2000 until 2004, Brent was an investment analyst at Invesco Funds Group. He started his financial career in 1997 as a credit analyst with Janus until 2000.

Brent received his bachelor of arts degree in anthropology from the University of Virginia. He earned his MBA with a concentration in finance from the University of Colorado and has 27 years of financial industry experience.

Tom Ross, CFA, Portfolio Manager at Janus Henderson Investors

Tom Ross is Head of High Yield at Janus Henderson Investors, a role he has held since 2022. In this role, Tom is responsible for leading investment strategy and portfolio management of the firm’s high yield franchise. He has served as a portfolio manager on the Corporate Credit Team since 2006. Prior to portfolio management, he specialised in credit trading on Henderson’s centralised dealing desk. He joined Henderson in 2002.

Tom graduated with a BSc degree (Hons) in biology from Nottingham University. He holds the Chartered Financial Analyst designation and has 22 years of financial industry experience.


1Source: Bloomberg, ICE BofA Global High Yield Index, total returns in US dollars, 30 September 2022 to 30 September 2024. Past performance does not predict future returns.
2Source: Bloomberg, ICE BofA US High Yield Index, ICE BofA Euro High Yield Index, 30 September 2024. Yields may vary over time and are not guaranteed.
3Source: Morgan Stanley Research, year to date to 30 September 2024.
4Source: Bureau of Economic Analysis. US Personal Consumption Expenditure, seasonally adjusted, year-on-year percentage change to 31 August 2024.
5Source: LSEG Datastream, MSCI China Index, total return in US dollars, 23 September 2024 to 30 September 2024. Past performance does not predict future returns.
6Source: Bloomberg, ICE BofA US High Yield Telecommunications Index, total return in US dollar from 30 June 2024 to 30 September 2024. Past performance does not predict future returns.


IMPORTANT INFORMATION
Fixed income securities are subject to interest rate, inflation, credit and default risk. The bond market is volatile. As interest rates rise, bond prices usually fall, and vice versa. The return of principal is not guaranteed, and prices may decline if an issuer fails to make timely payments or its credit strength weakens.
High-yield or “junk” bonds involve a greater risk of default and price volatility and can experience sudden and sharp price swings.
Past performance does not predict future returns. There is no guarantee that past trends will continue or forecasts will be realised.
The opinions and views expressed are as of the date published and are subject to change. They are for information purposes only and should not be used or construed as an offer to sell, a solicitation of an offer to buy, or a recommendation to buy, sell or hold any security, investment strategy or market sector. No forecasts can be guaranteed. Opinions and examples are meant as an illustration of broader themes, are not an indication of trading intent and may not reflect the views of others in the organization. It is not intended to indicate or imply that any illustration/example mentioned is now or was ever held in any portfolio. Janus Henderson Group plc through its subsidiaries may manage investment products with a financial interest in securities mentioned herein and any comments should not be construed as a reflection on the past or future profitability. There is no guarantee that the information supplied is accurate, complete, or timely, nor are there any warranties with regards to the results obtained from its use. Past performance is no guarantee of future results. Investing involves risk, including the possible loss of principal and fluctuation of value.
Janus Henderson Group plc ©
Orion Portfolio Solutions, LLC, an Orion Company, is a registered investment advisor.
Orion and Janus Henderson are not affiliated in any manner.
The CFA® is a globally respected, graduate-level investment credential established in 1962 and awarded by CFA Institute — the largest global association of investment professionals. To learn more about the CFA charter, visit www.cfainstitute.org.

Compliance Code: 3 0 1 6, Orion Portfolio Solutions, November 22, 2024