


-
Another big week of corporate earnings ahead. This week, leading tech firms such as Amazon, Alphabet, Meta and Microsoft all report. Needless to say, tech earnings are key for the market.
-
On this point, it should be noted that the stocks known as FAANG+MNT (Microsoft, NVIDIA, and Tesla) are now over 25% of the S&P 500's market cap, and have contributed over 80% of this year’s stock market gains as of April 17th.
-
In fact, Apple's current 7%+ weighting in the S&P 500 would be the largest for any single company in the index with data going back to 1980.
-
Given the history that top companies typically don't stay on top over time, it would also be wise counsel to suggest that investors remain invested not only due to the market’s powerful tendency to produce positive long-term returns over time, but investors also need to diversify to maintain wealth.
-
- As for performance last week, the overall market was essentially unchanged.
- There were sub 1% gains in mid-caps and small caps, with near 2% losses in emerging markets and commodities.
- YTD, gains have been led by large cap and growth stocks, with the S&P 500 up over 8%. Growth stocks are up over 14%, continuing to reverse some of the severe drawdowns experienced in 2022.
- Balanced portfolios are still in good shape for the year, with bonds up a little over 3%.
- According to Bespoke investments, it has been just over six months since the S&P 500’s low last October when the index was 25% below its 52-week high.
- Since WW2, we found 13 prior periods in which the S&P made a major low after a 20%+ drop and then didn't make a new low in the next six months, and six and twelve months after those first six months, the S&P 500 was higher twelve times
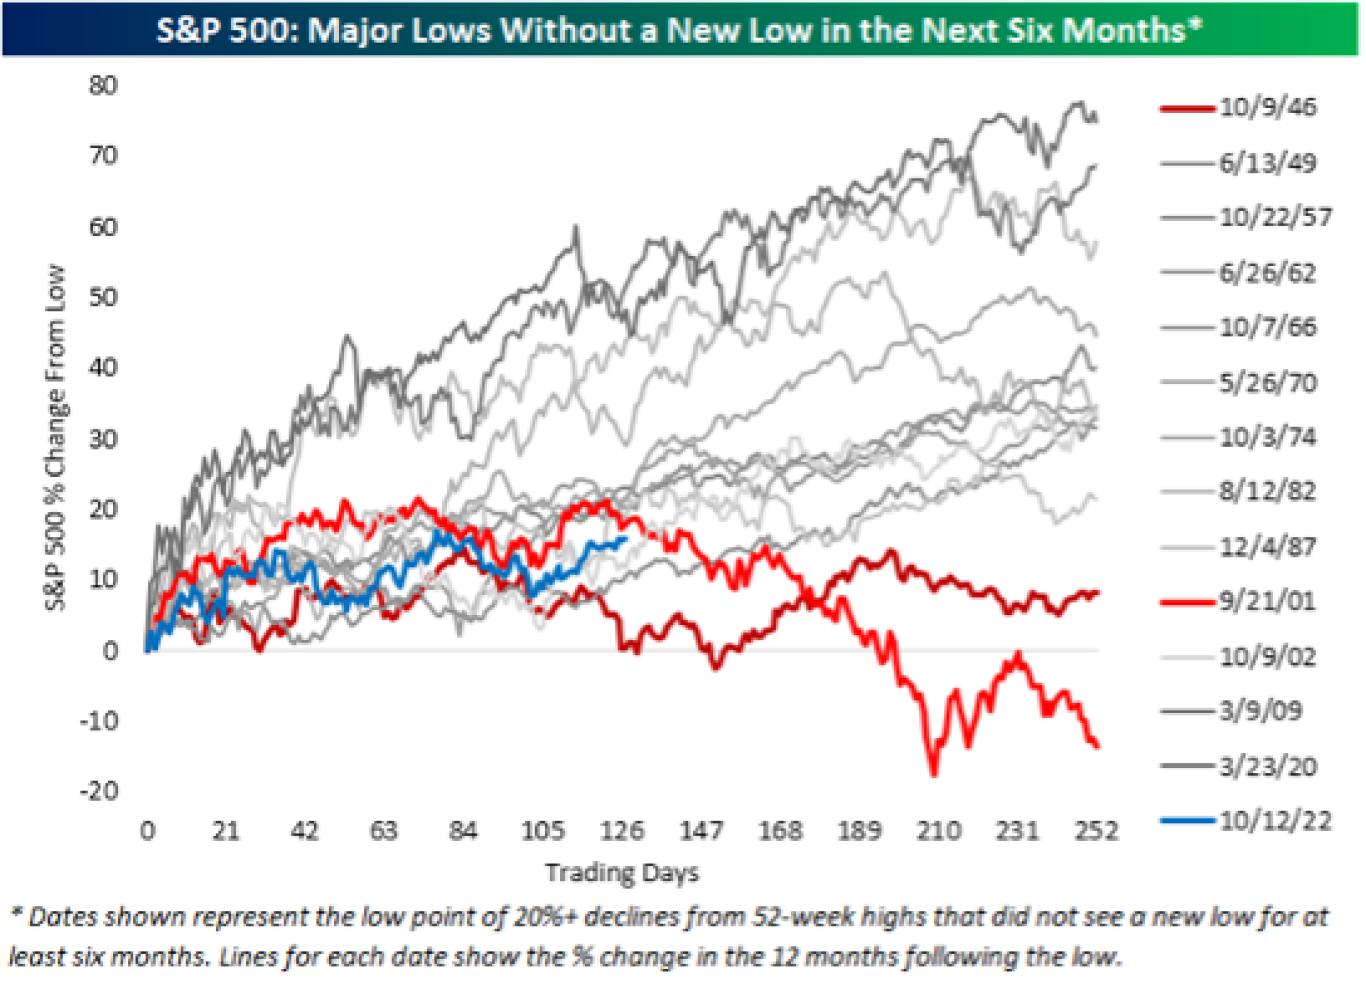
Source: Bespoke Investments
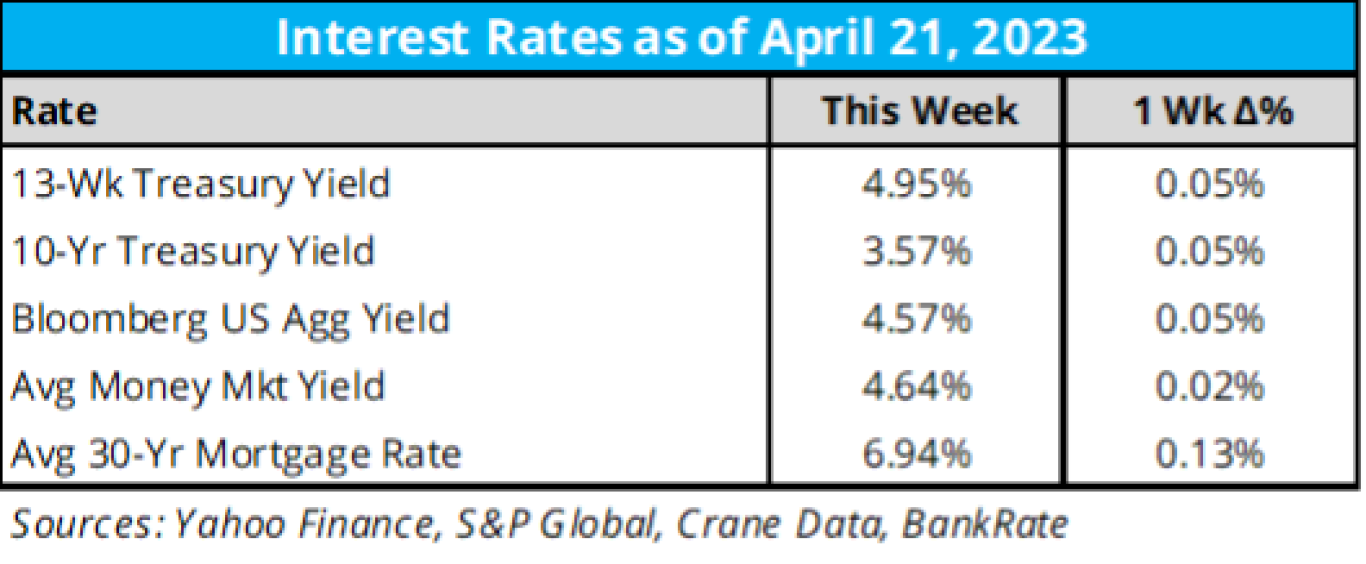
- As for key interest rates last week:
- Interest rates broadly rose again this week.
- The 13-week yield closed above 5% on Tuesday for the first time since February 2007 and closed the week at 4.95%.
- The average 30-year mortgage rate rose 13 bps last week and is now back approaching 7%.
- Inversion between the 2-and-10-year treasury yields represents one of the most consistent recession indicators. However, the inversion’s current level of 60 basis points is showing improvement from the deepest inversion of 107 basis points in early March 2023. The curve has been inverted since July 2022, which represents the longest inversion since 2006-2007.
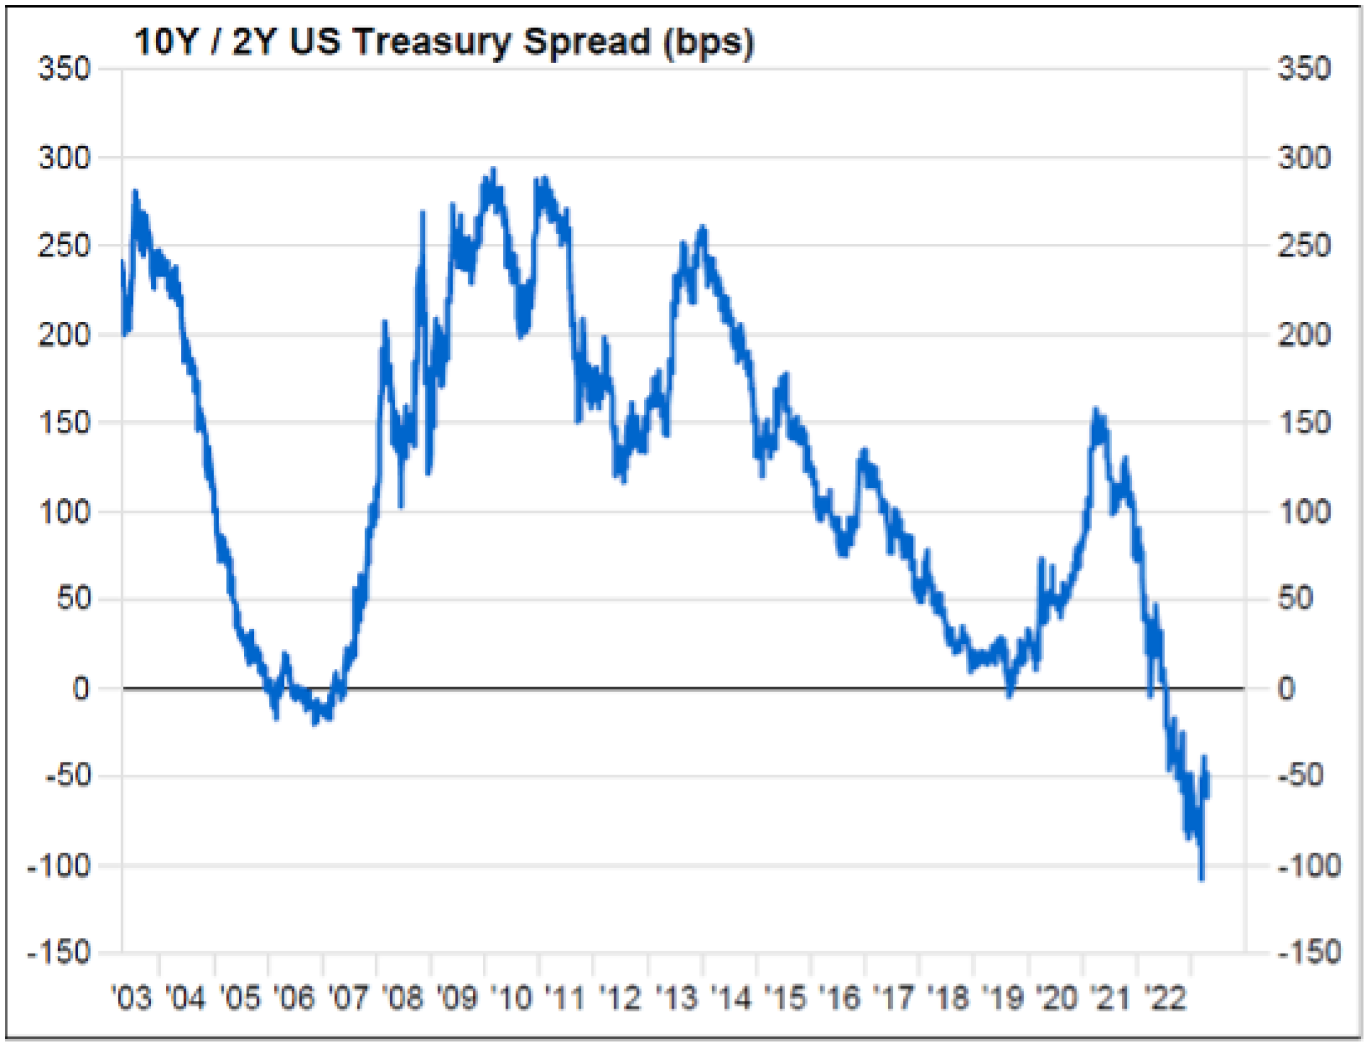
Source: YCharts
- We’re now only 9 days out from the next Fed interest rate decision, and as of now, according to the CME Fed Watch tool: (which has arguably been one of the key charts to watch this year)
- At a current target range of 475-500, the market is now pricing in a 90% chance of another 25 basis-point increase at the May Fed meeting.
- Expected returns from Vanguard over the next 10 years:
- Non-US stocks lead the way (though show lower expected returns than others have forecasted).
- US growth stocks expected returns lag (but still show better returns than some have forecasted).
- What’s missing from this table IMO are expected correlations. Commodities, for instance, which have the lowest expected volatility will also surely have the lowest correlations.
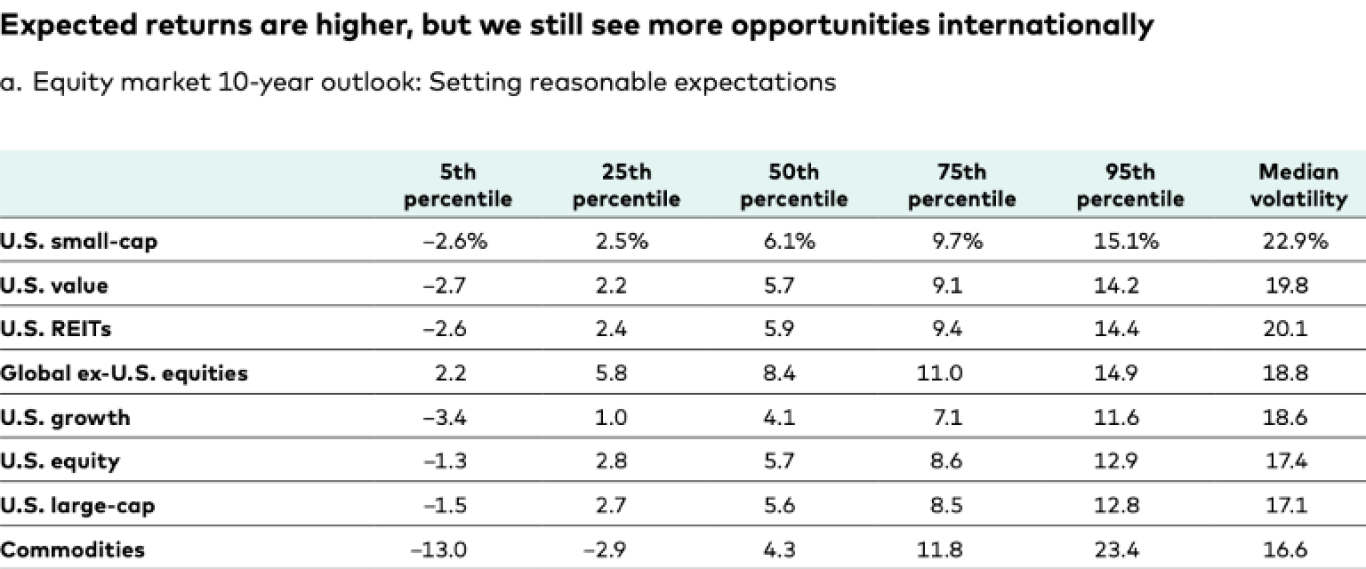
Source: Vanguard
- An update on one of my favorite market papers ever: Long-term shareholder returns: Evidence from 64,000 global stocks by Henrik Bessembinder. Hat tip to Meb Faber for identifying the update. This paper gives a powerful reason to use professionally managed funds as opposed to trying to pick individual stocks. Faber’s summary:
- Hendrik Bessembinder analyzes long-run shareholder outcomes for over 64,000 global common stocks during the January 1990 to December 2020 period. A few takeaways:
- 55.2% of U.S. stocks and 57.4% of non-U.S. stocks underperform one-month U.S. Treasury bills in terms of compound returns over the full sample
- The top-performing 2.4% of firms account for all of the $US 75.7 trillion in net global stock market wealth creation from 1990 to December 2022
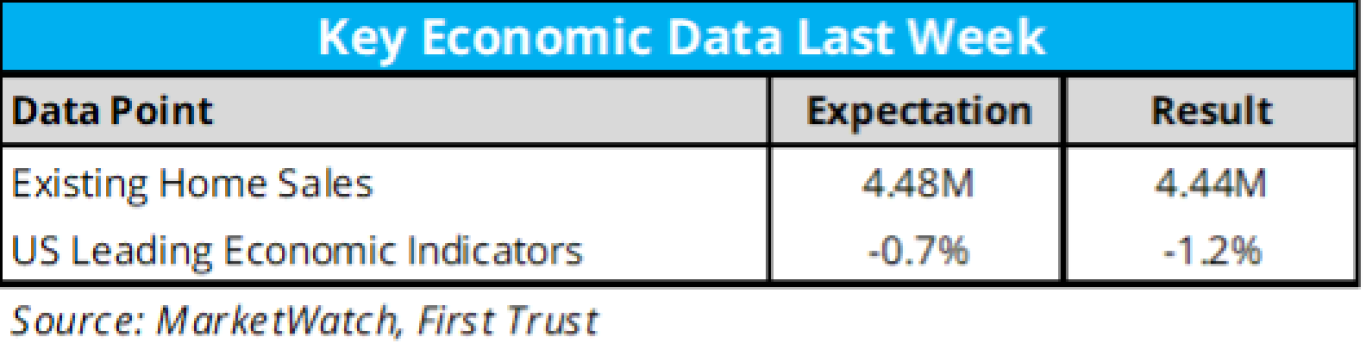
- Last week’s economic data calendar was light:
- Existing home sales came in just under expectations. Sales are down 2.4% in March and down 22% since a year ago.
- The US Leading Economic Indicator index came in surprisingly low.
- Home Prices Fell 3% in March—Biggest Annual Drop in Over a Decade, but here are the cities that gained in prices over the last year:
- The biggest declines were in Boise (-15.4%), Austin (-13.7%), Sacramento (-11.9%), San Jose (-10.5%) and Oakland (-9.7%).
- The biggest increases were in Milwaukee (11.7%), El Paso (11.1%), Omaha (10.7%), Camden (10.2%) and Knoxville (10.2%)
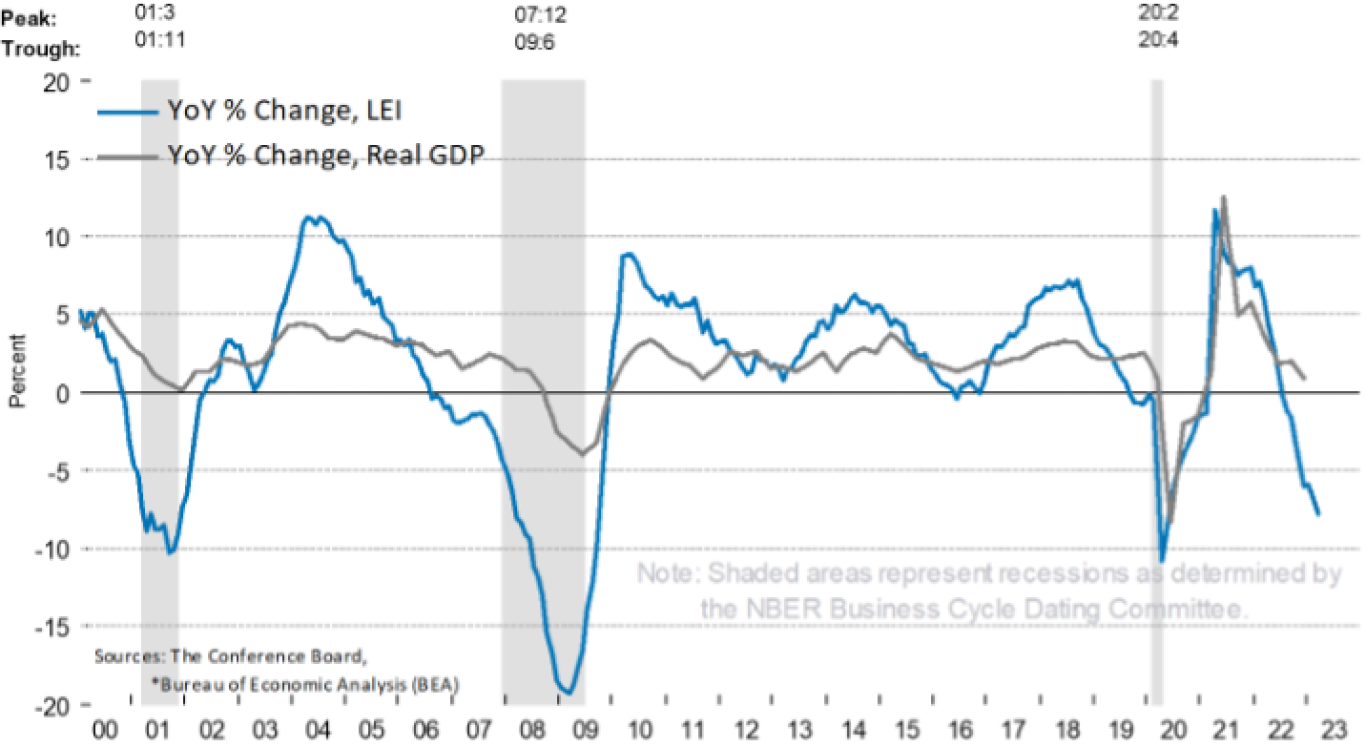
- The index of US Leading Economic Indicators from the Conference Board is designed to “signal peaks and troughs in the business cycle for major economies around the world.”
- The index fell by 1.2% in March following a 0.5% decline in February. The LEI is down 4.5% over the recent 6-month period between September and March.
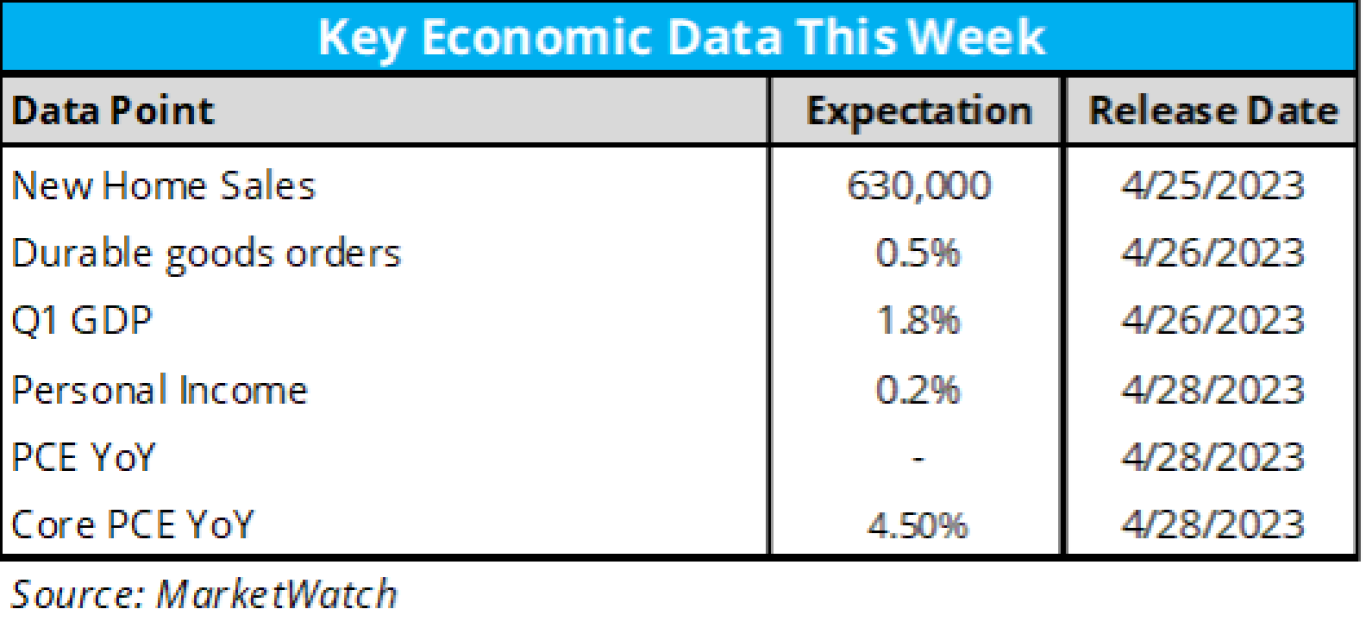
- Here is the economic data calendar for this week.
- Notably, we will get the final result for Q1 GDP and the Fed’s preferred inflation gauge, Personal Consumption Expenditures (PCE)
- Another Meb Faber find: Research Affiliates predicts inflation will dip to 2.9% by mid-year before surging back to 5.7% by year-end.
- This week’s Earnings Insight from Factset:
- Earnings Scorecard: For Q1 2023 (with 18% of S&P 500 companies reporting actual results), 76% of S&P 500 companies have reported a positive EPS surprise and 63% of S&P 500 companies have reported a positive revenue surprise.
- Earnings Decline: For Q1 2023, the blended earnings decline for the S&P 500 is -6.2%. If -6.2% is the actual decline for the quarter, it will mark the largest earnings decline reported by the index since Q2 2020 (-31.6%).
- Since peaking in 2021, operating earnings have flatlined around $50 per share, according to S&P Global (via the Independent Vanguard Adviser).
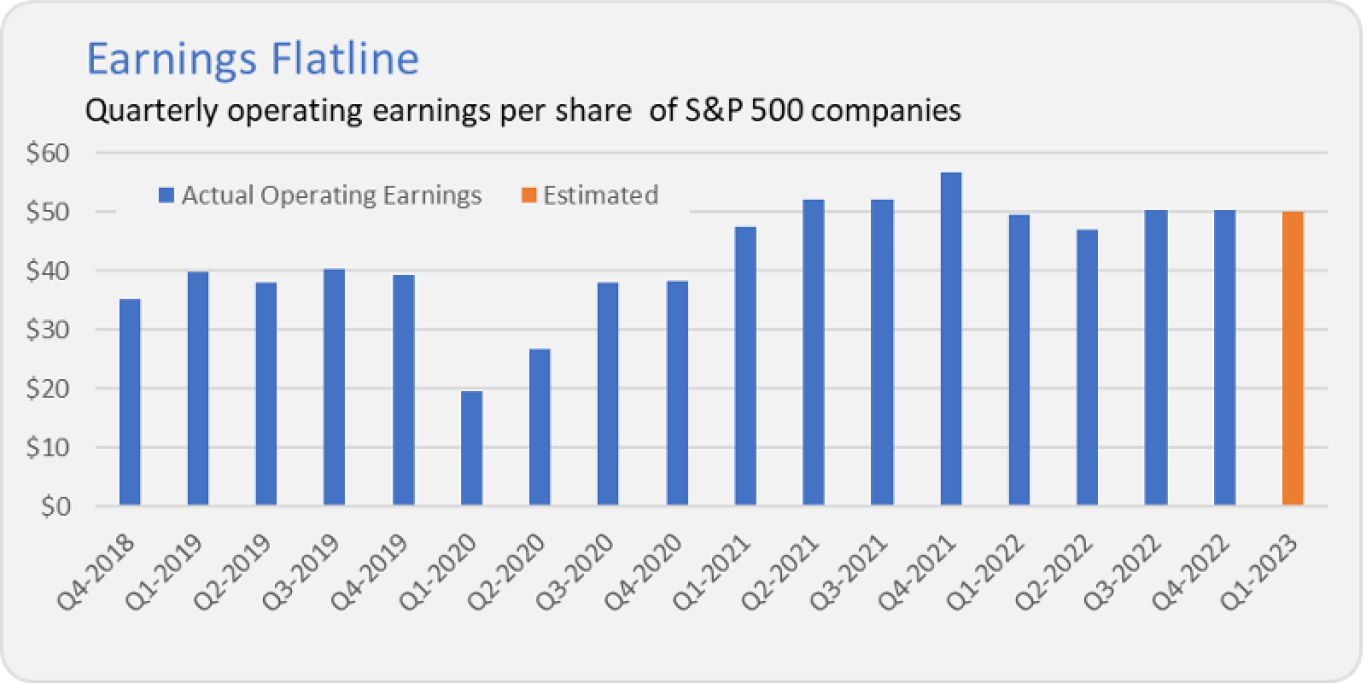
Source: S&P Global and The IVA
Crypto Corner with Grant Engelbart, CFA, CAIA, Senior Portfolio Manager
- Cryptocurrency prices dropped last week, with Bitcoin falling -10% and Ethereum dropping nearly -14%. Bitcoin hovered around $27,500 and Ethereum around $1,850, after breaking above $30,000 and $2,000 respectively the prior week. Most other major coins fell double digits.
- SEC Chairman Gary Gensler highlighted that there have been 1,500 enforcement actions since he’s been Chair. Meanwhile, other lawmakers are increasingly bringing pressure on the SEC for more regulation and less enforcement. SocGen’s crypto arm launched a Euro-based stablecoin. Despite the huge recovery in crypto prices this year, NFT trading volumes are declining. Coinbase obtained a license from Bermuda to open a derivatives exchange in the coming weeks.
- No new digital asset ETF news.
- It’s been difficult to decide on just one quote of the week, so here are a few to consider:
- Investors should always remain humble and remember that “what you don’t know is greater than what you do know” –Ray Dalio
- Most of what we perceive as problems will magically go away after a walk outside and a good night’s sleep” –Mark Manson
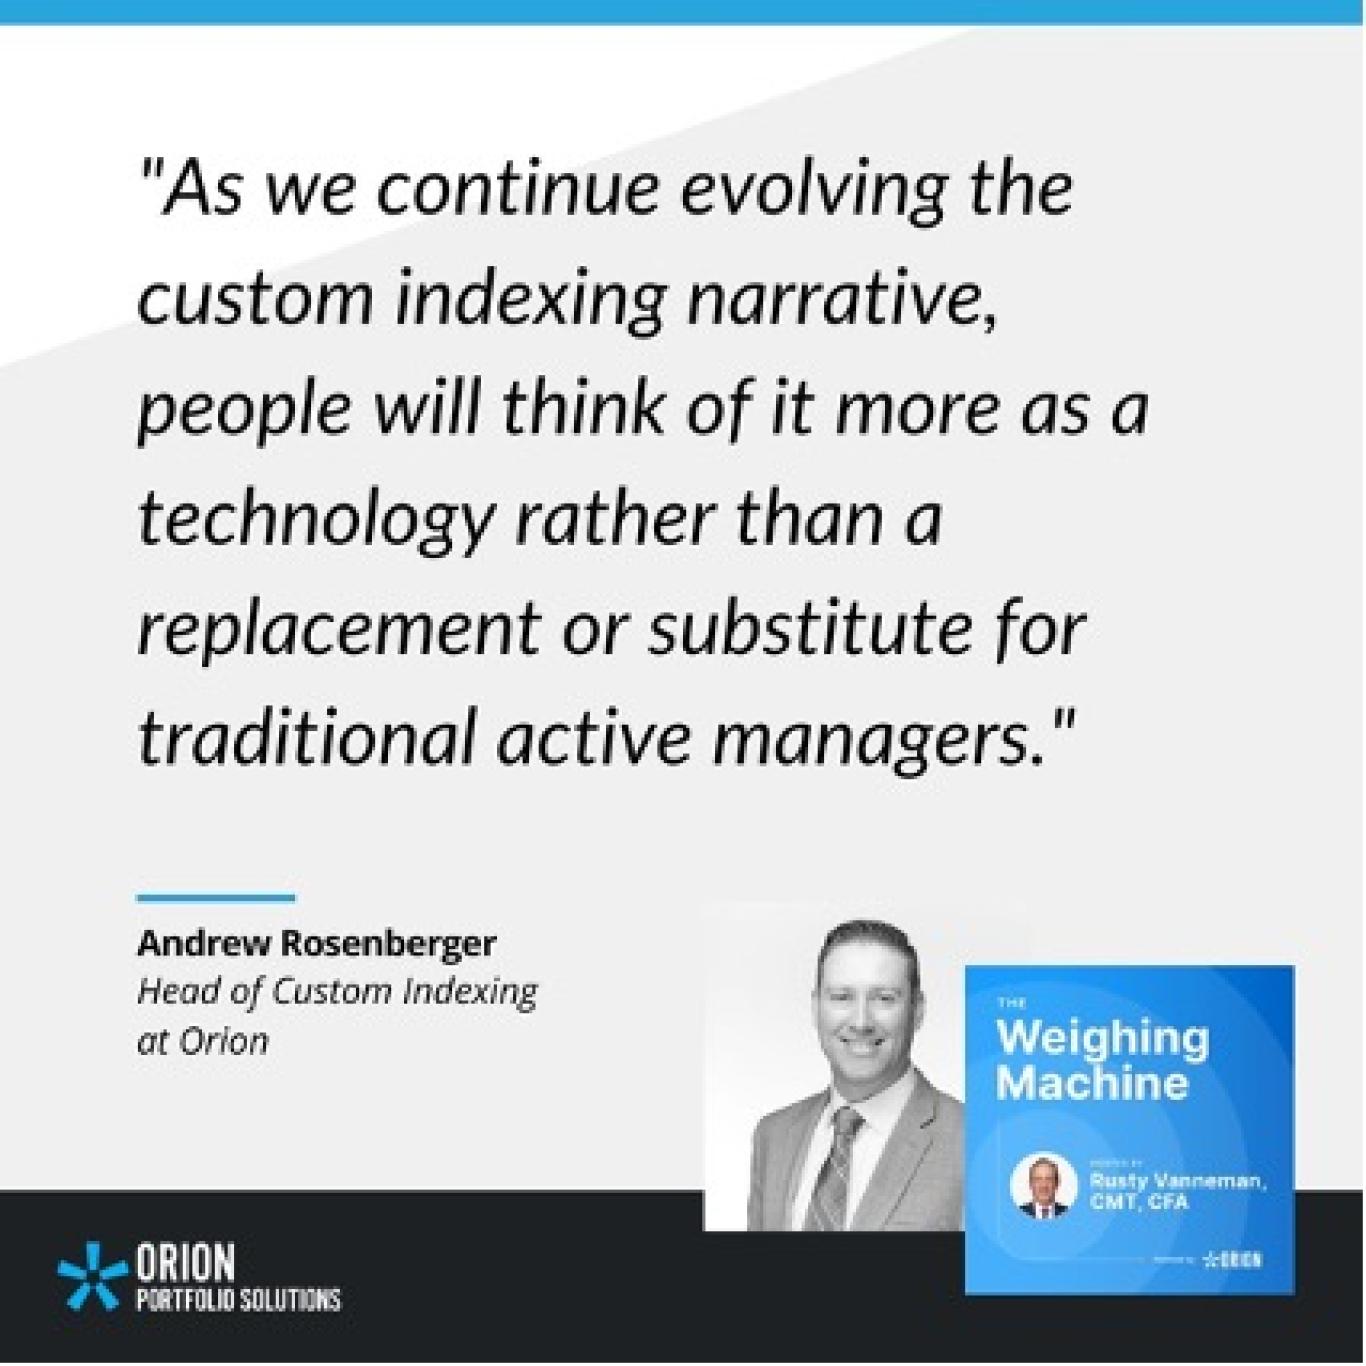
- On this week’s Orion's The Weighing Machine podcast we talk to Orion’s Head of Custom Indexing, Andrew Rosenberger. Andy, Rusty, and Robyn discuss the industry adoption of direct indexing and how Orion is leveraging technology to bring custom, tax-managed portfolios to clients.
- Great stats on the tax-loss harvesting benefit from 10-year study from robo-advisor Wealthfront:
- The bottom line: Wealthfront has generated about $3,735 of TLH per month, on average, for every $1 million it manages. That's $44,826 per year, or about 4.5%.
- Between the lines: New inflows are key to keeping the TLH machine humming. If stocks broadly go up over time, then a portfolio that has been held for many years is unlikely to see many losses, even during bear markets.
- Speaking of custom indexing, we asked ChatGPT to tell us how fast the custom and direct indexing space is growing. While the results were relatively surface level, ChatGPT did pull some interesting stats on the space.
- The custom and direct indexing space is experiencing significant growth in recent years. According to a report by Cerulli Associates, a global research and consulting firm, the assets in custom index strategies grew to $1.7 trillion in 2020, up from $1.2 trillion in 2019, representing a growth rate of 41%. The report also projects that assets in custom indexing will reach $2.6 trillion by 2024.
- This growth is being driven by several factors, including increasing demand from investors for more tailored investment solutions, advancements in technology that make it easier and more cost-effective to create custom indexes, and the potential tax benefits associated with direct indexing.
- In addition, the growth of direct indexing has been fueled by the emergence of digital investment platforms that allow investors to create and manage their own portfolios of individual stocks and securities. These platforms offer investors a low-cost and easy way to build custom indexes that align with their investment goals and preferences.
- Overall, the custom and direct indexing space is expected to continue to grow as investors seek more personalized investment solutions and technology continues to advance, making it easier and more cost-effective to create custom indexes.
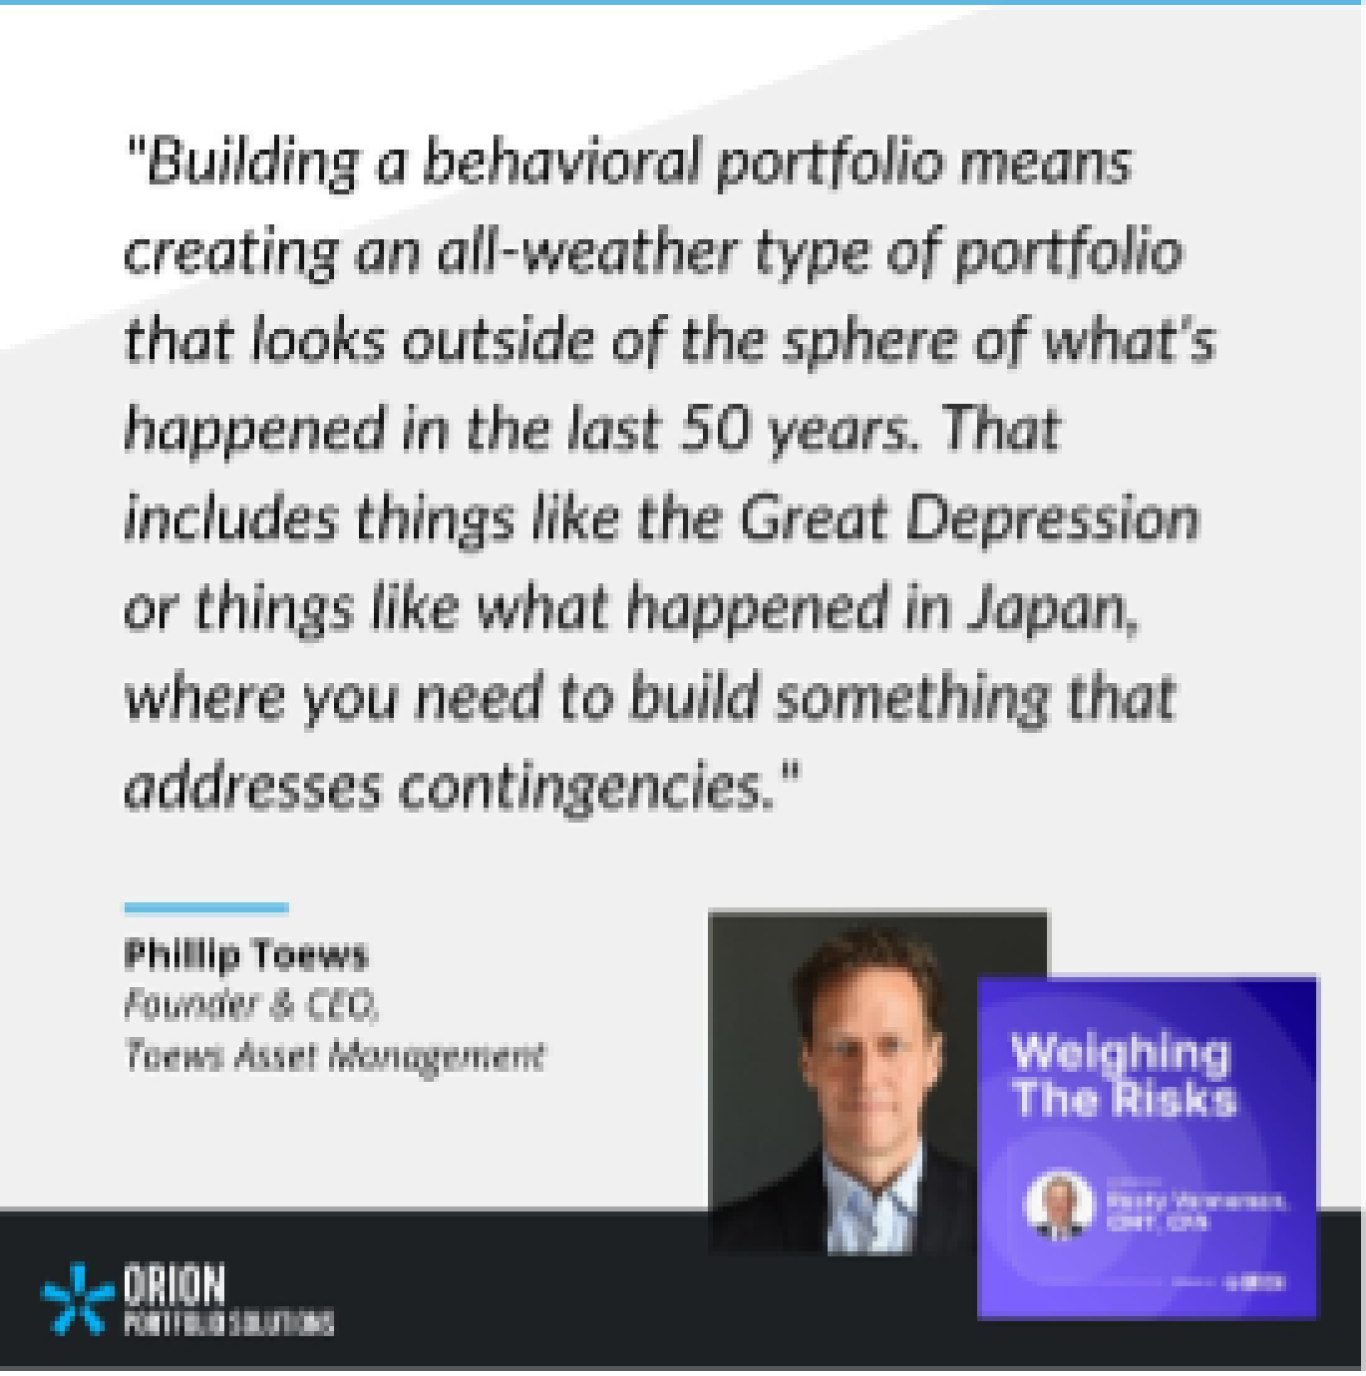
- This month’s Weighing The Risks deals with the hidden implications of massive global debt with Phil Toews, the president and CEO of Toews Asset Management. Felipe and I covered a lot of this ground in a recent TWM podcast, but this time we explore different scenarios on how this could play out in the financial markets, including stocks, bonds, and real assets.
- If you’re looking for more podcast recommendations this week, Orion’s Dr. Daniel Crosby interviewed Manish Khatta, CEO/CIO of Potomac Fund Management on the Standard Deviations Podcast.
- Will AI steal your job? This creative video from Zeihan Research highlights the differences between an output from a program like ChatGPT and human-written video scripts. The highlights:
- Copy editors could be in trouble, the ChatGPT script was grammatically flawless.
- However, the content was shallow. While ChatGPT picked up words and topics that had been used by Peter in the past, it struggled to digress on what those words mean and make meaningful connections and analyses.
- A little more on AI from Orion’s founder Eric Clarke, who appeared on The Big Reveal Podcast last month to discuss the vision of Orion and where AI fits into Wealth Management.
- How did your tax return compare last year? Well, according to this article the average taxpayer in the United States paid $13,367 in federal income taxes in 2022. See where that money went.
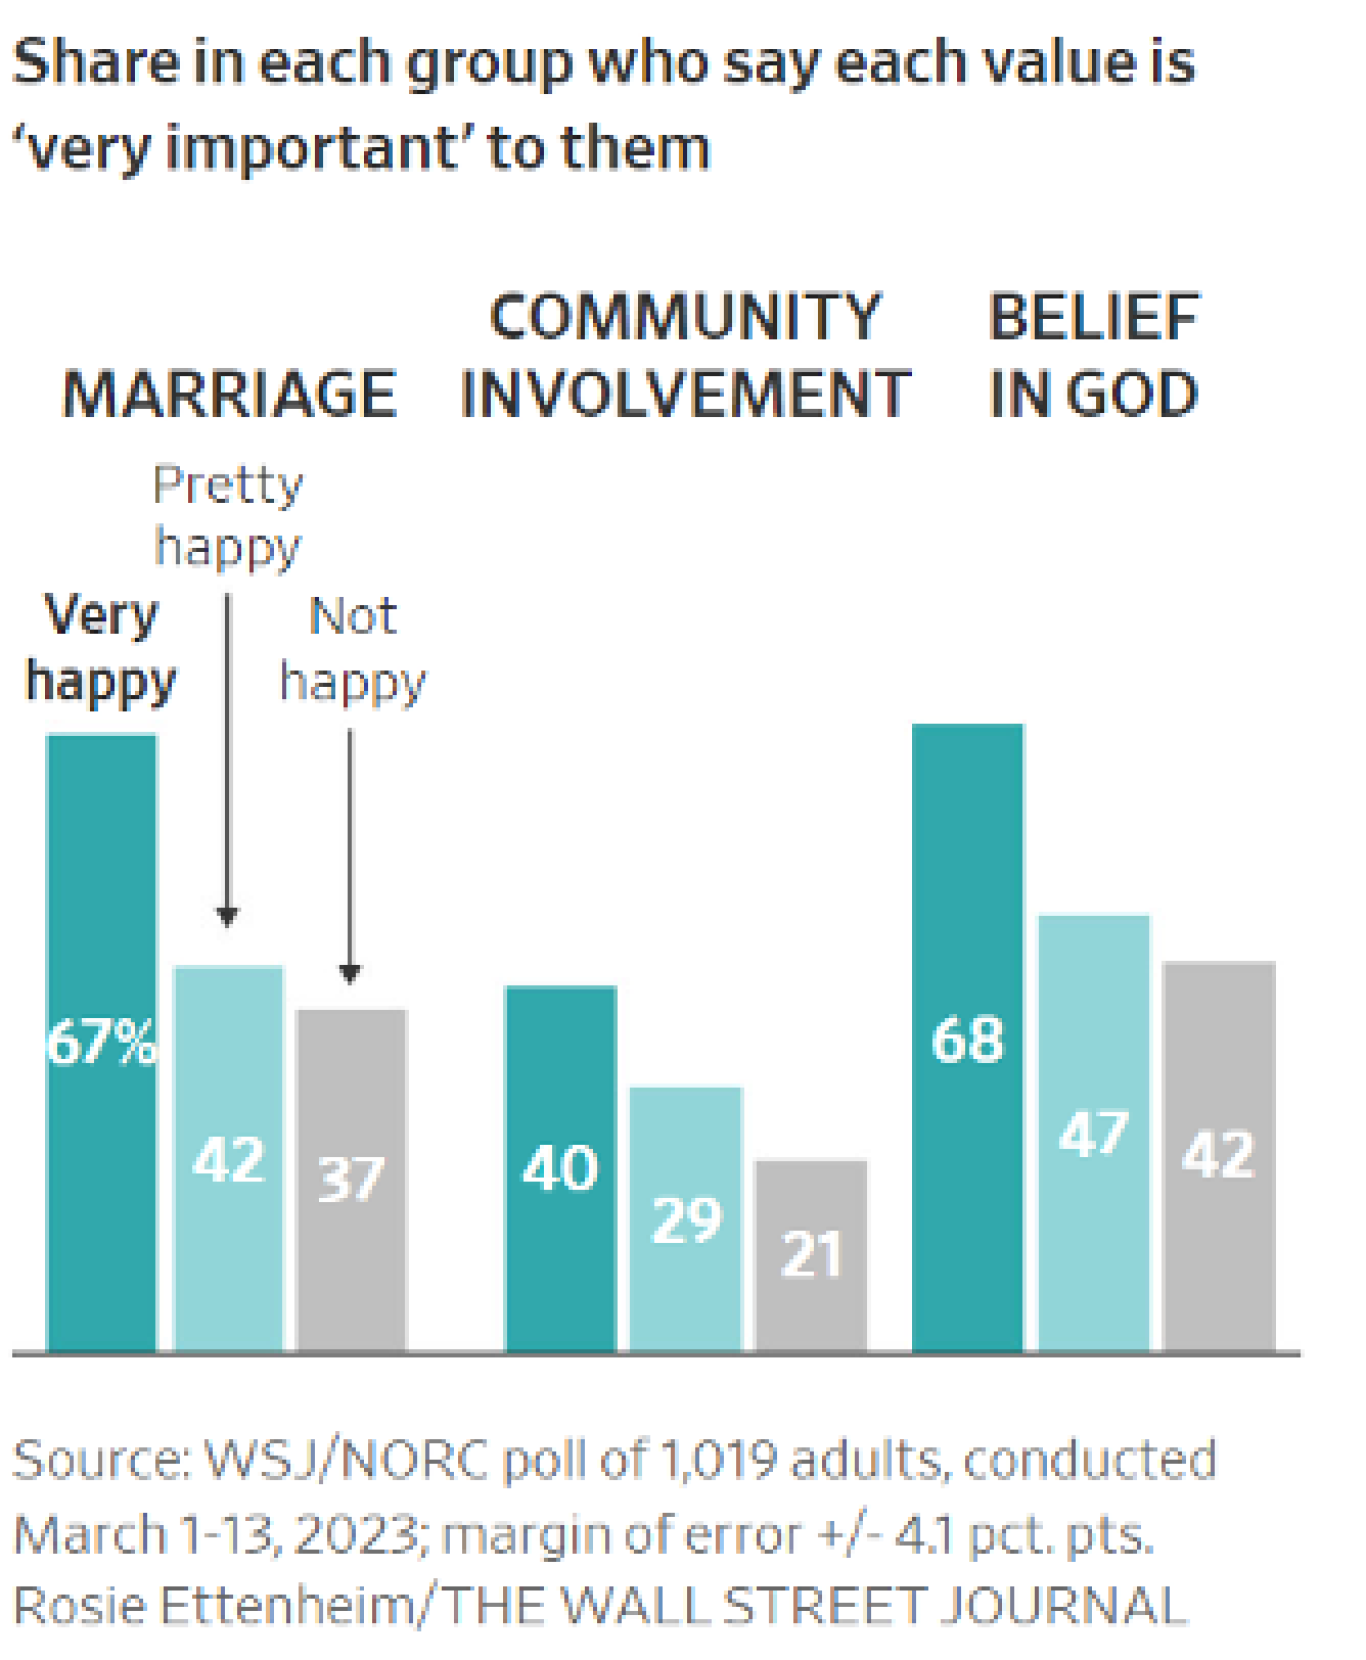
- Given all this talk on taxes being paid and changes from AI, here are some interesting stats from a Wall Street Journal article that surveyed the happiest people in America (which only about 1 out 8 people said they were):
1162-OAS-4/25/2023