


Video Transcript
Hey, everyone. I'm Ben Vaske, senior investment strategist here at Orion. I'm recording this video just after market closed on March 18, where we unfortunately had another broadly negative day in the stock market with the S&P 500 losing just over 1%.
That being said, we're really not panicking about this price action.
So if we're not panicking, why does this sell off feel so jarring for investors?
For context, we generally see at least one 10% correction per year on average.
However, we haven't seen this type of correction in about a year and a half, dating all the way back to October of 2023, which you can see on that red circle on the chart here.
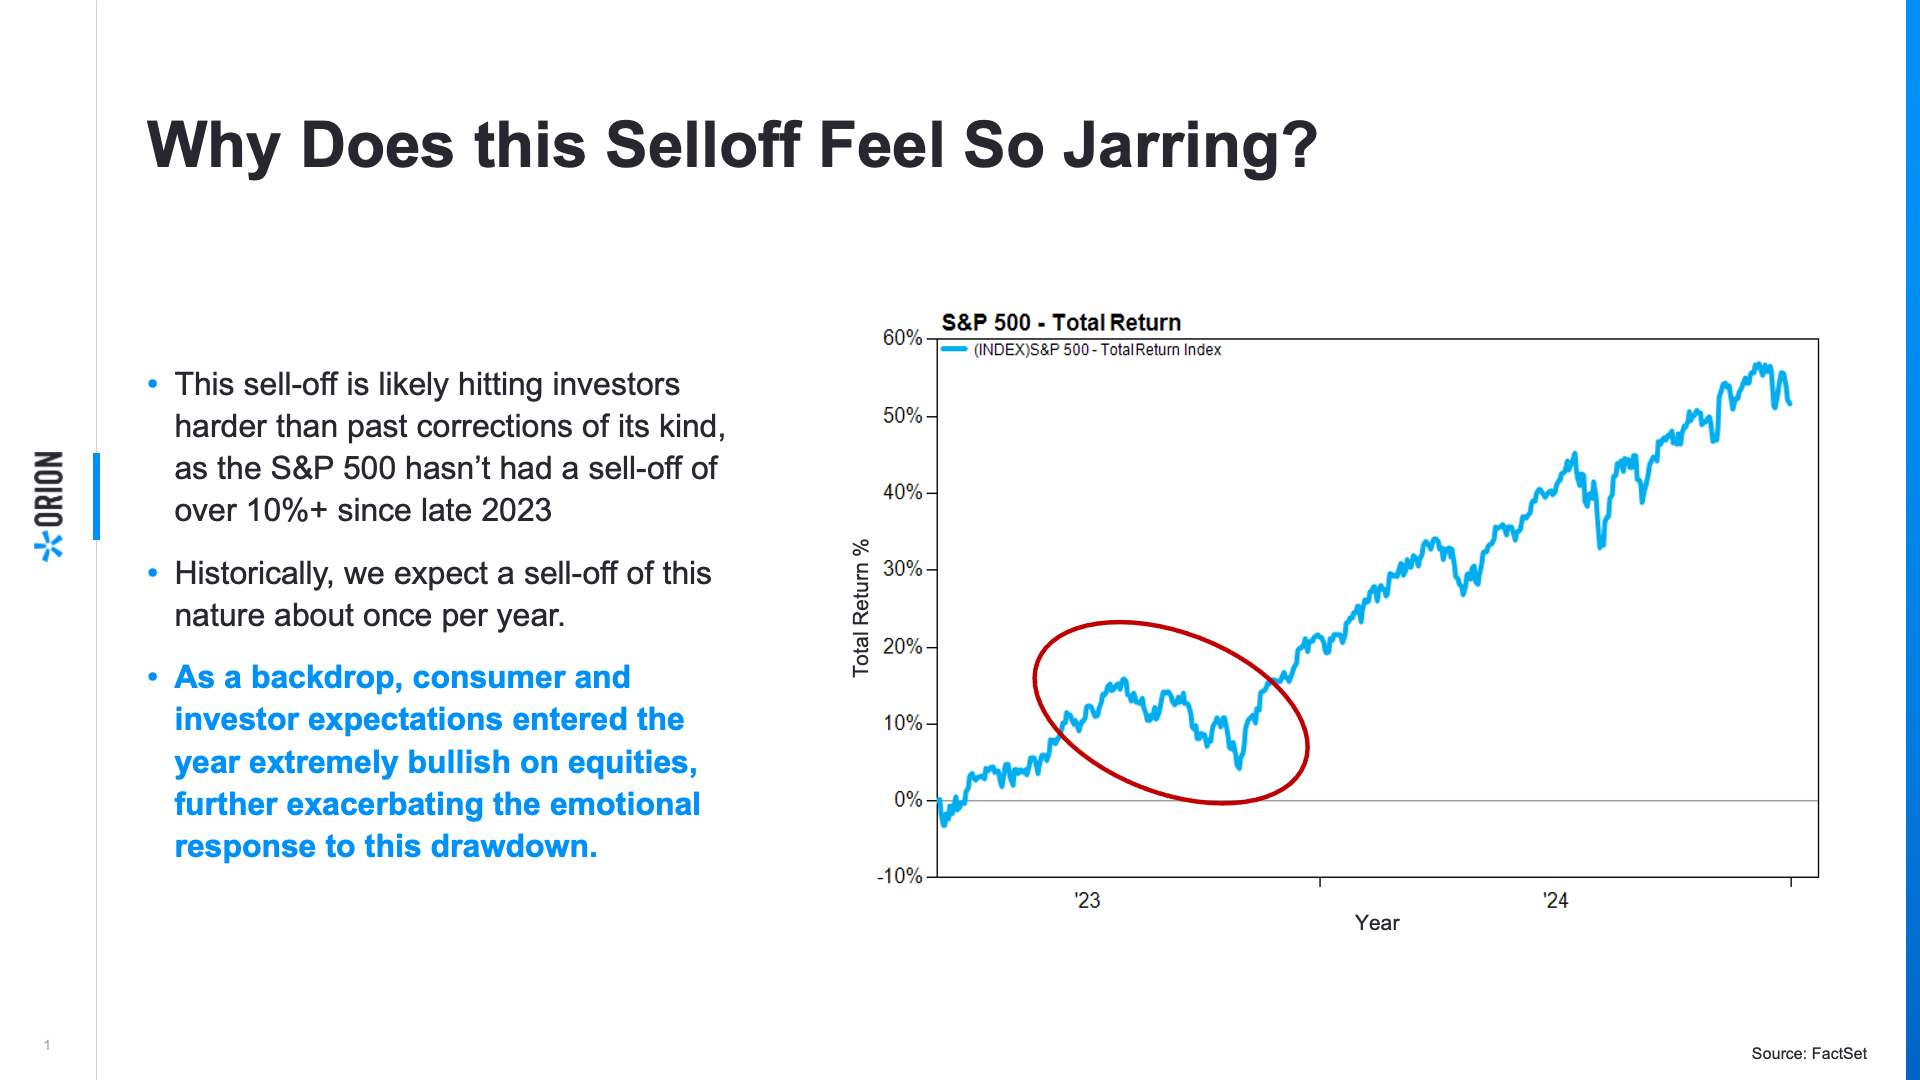
With a low-volatility, low-drawdown environment like we saw for all of 2024, it's not surprising to see investors experiencing a little bit of recency bias as it pertains to market corrections.
Additionally, given 2024's market strength, we saw some pretty outsized, very bullish expectations for 2025 market returns, which may be increasing the emotional effects that this drawdown is having on investors.
To provide a long-term context, let's look at this chart here, which explains to us how intra-year corrections are really the norm, not the exception for market movement.
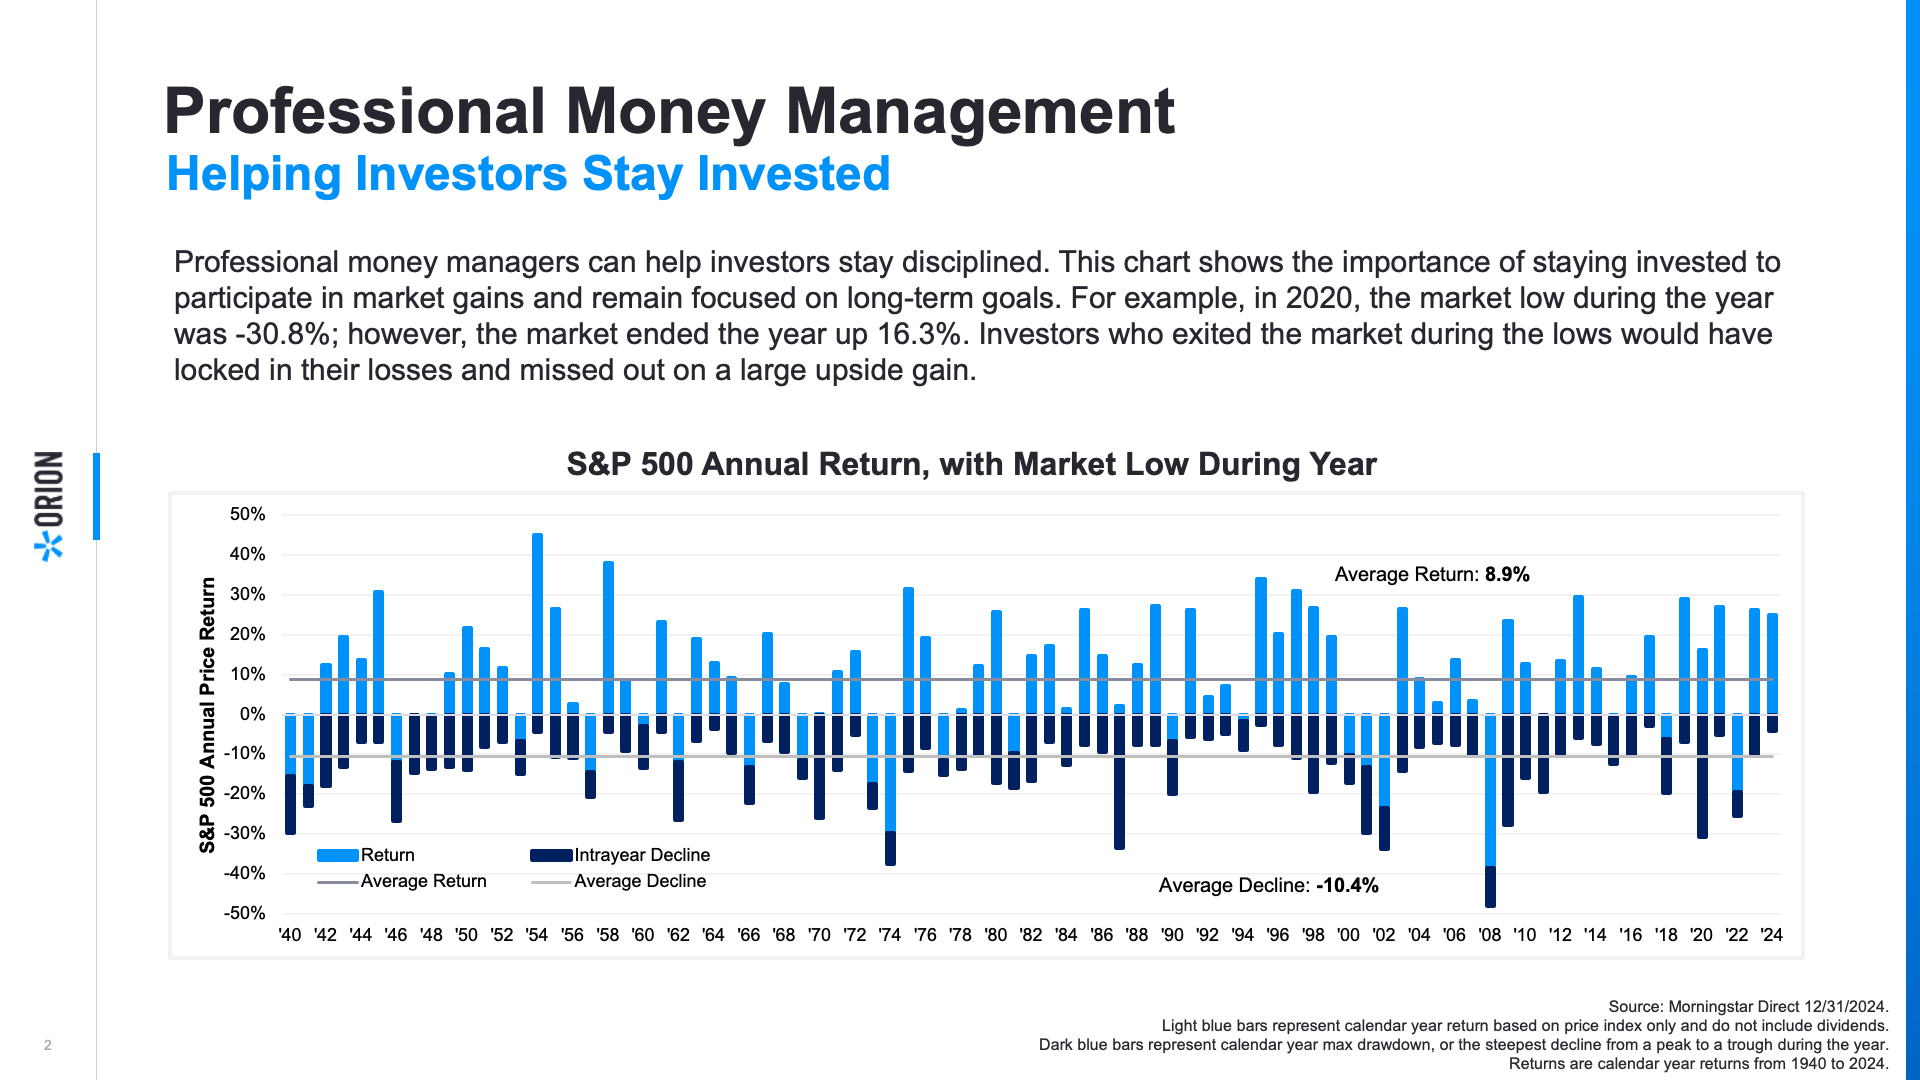
The dark blue lines here on this chart represent the max drawdown of each calendar year for the S&P 500, with the light blue lines representing where the market finished the year. As you can see, despite there being a big, scary, dark blue line on almost every year, the light blue lines are above 0% most of the time.
And generally, we see stocks move up about 75% of the time.
A perfect example of this relationship would be 2020, where we saw a drawdown of over 30% earlier in the year but ended the year with over a 16% gain on the S&P 500.
While drawdowns in volatility like we've been experiencing are never welcome and potentially tough to stomach, we view this market movement as a healthy reset for some parts of the market, where we're seeing some recent warning signs, like extended valuations and very narrow market breadth, starting to improve.
Thanks for checking in. And as always, if there's anything we can do to help you here at Orion, please let us know. Thanks.