


Video Transcript
Hey, everyone. I'm Ben Vaske, senior investment strategist here at Orion. Checking in again just after market close on April 8, 2025. What opened today is kind of a welcome rally in equity markets turned out to be a bit of a dead cap bounce, and some are considering today a bull trap or foreseeing further impending equity market declines.
Something I wanna discuss today, however, is how some short-term indicators could be wreaking havoc on markets and actually could potentially queue up some strength going forward.
There's no doubt that aggressive tariff policy coming out of the US is sending shocks of uncertainty through markets and could hit bottom-line figures like inflation, corporate earnings, and consumer strength. However, something that people tend to forget is that markets are made up of people just like you and me, and emotions and sentiment can severely drive short-term returns at a more volatile pace than market fundamentals might suggest.
As of today, the S&P 500 is sitting at extremely oversold levels, the fear and greed index is in extreme fear territory, and the investments investor sentiment survey from the American Association of Individual Investors is sitting at its most bearish bull/bear spread since late 2022.
Now something our team has researched, something to consider, is the probabilities associated with various investor sentiment readings. And what we found is that contrarianism on average proves to be fruitful.
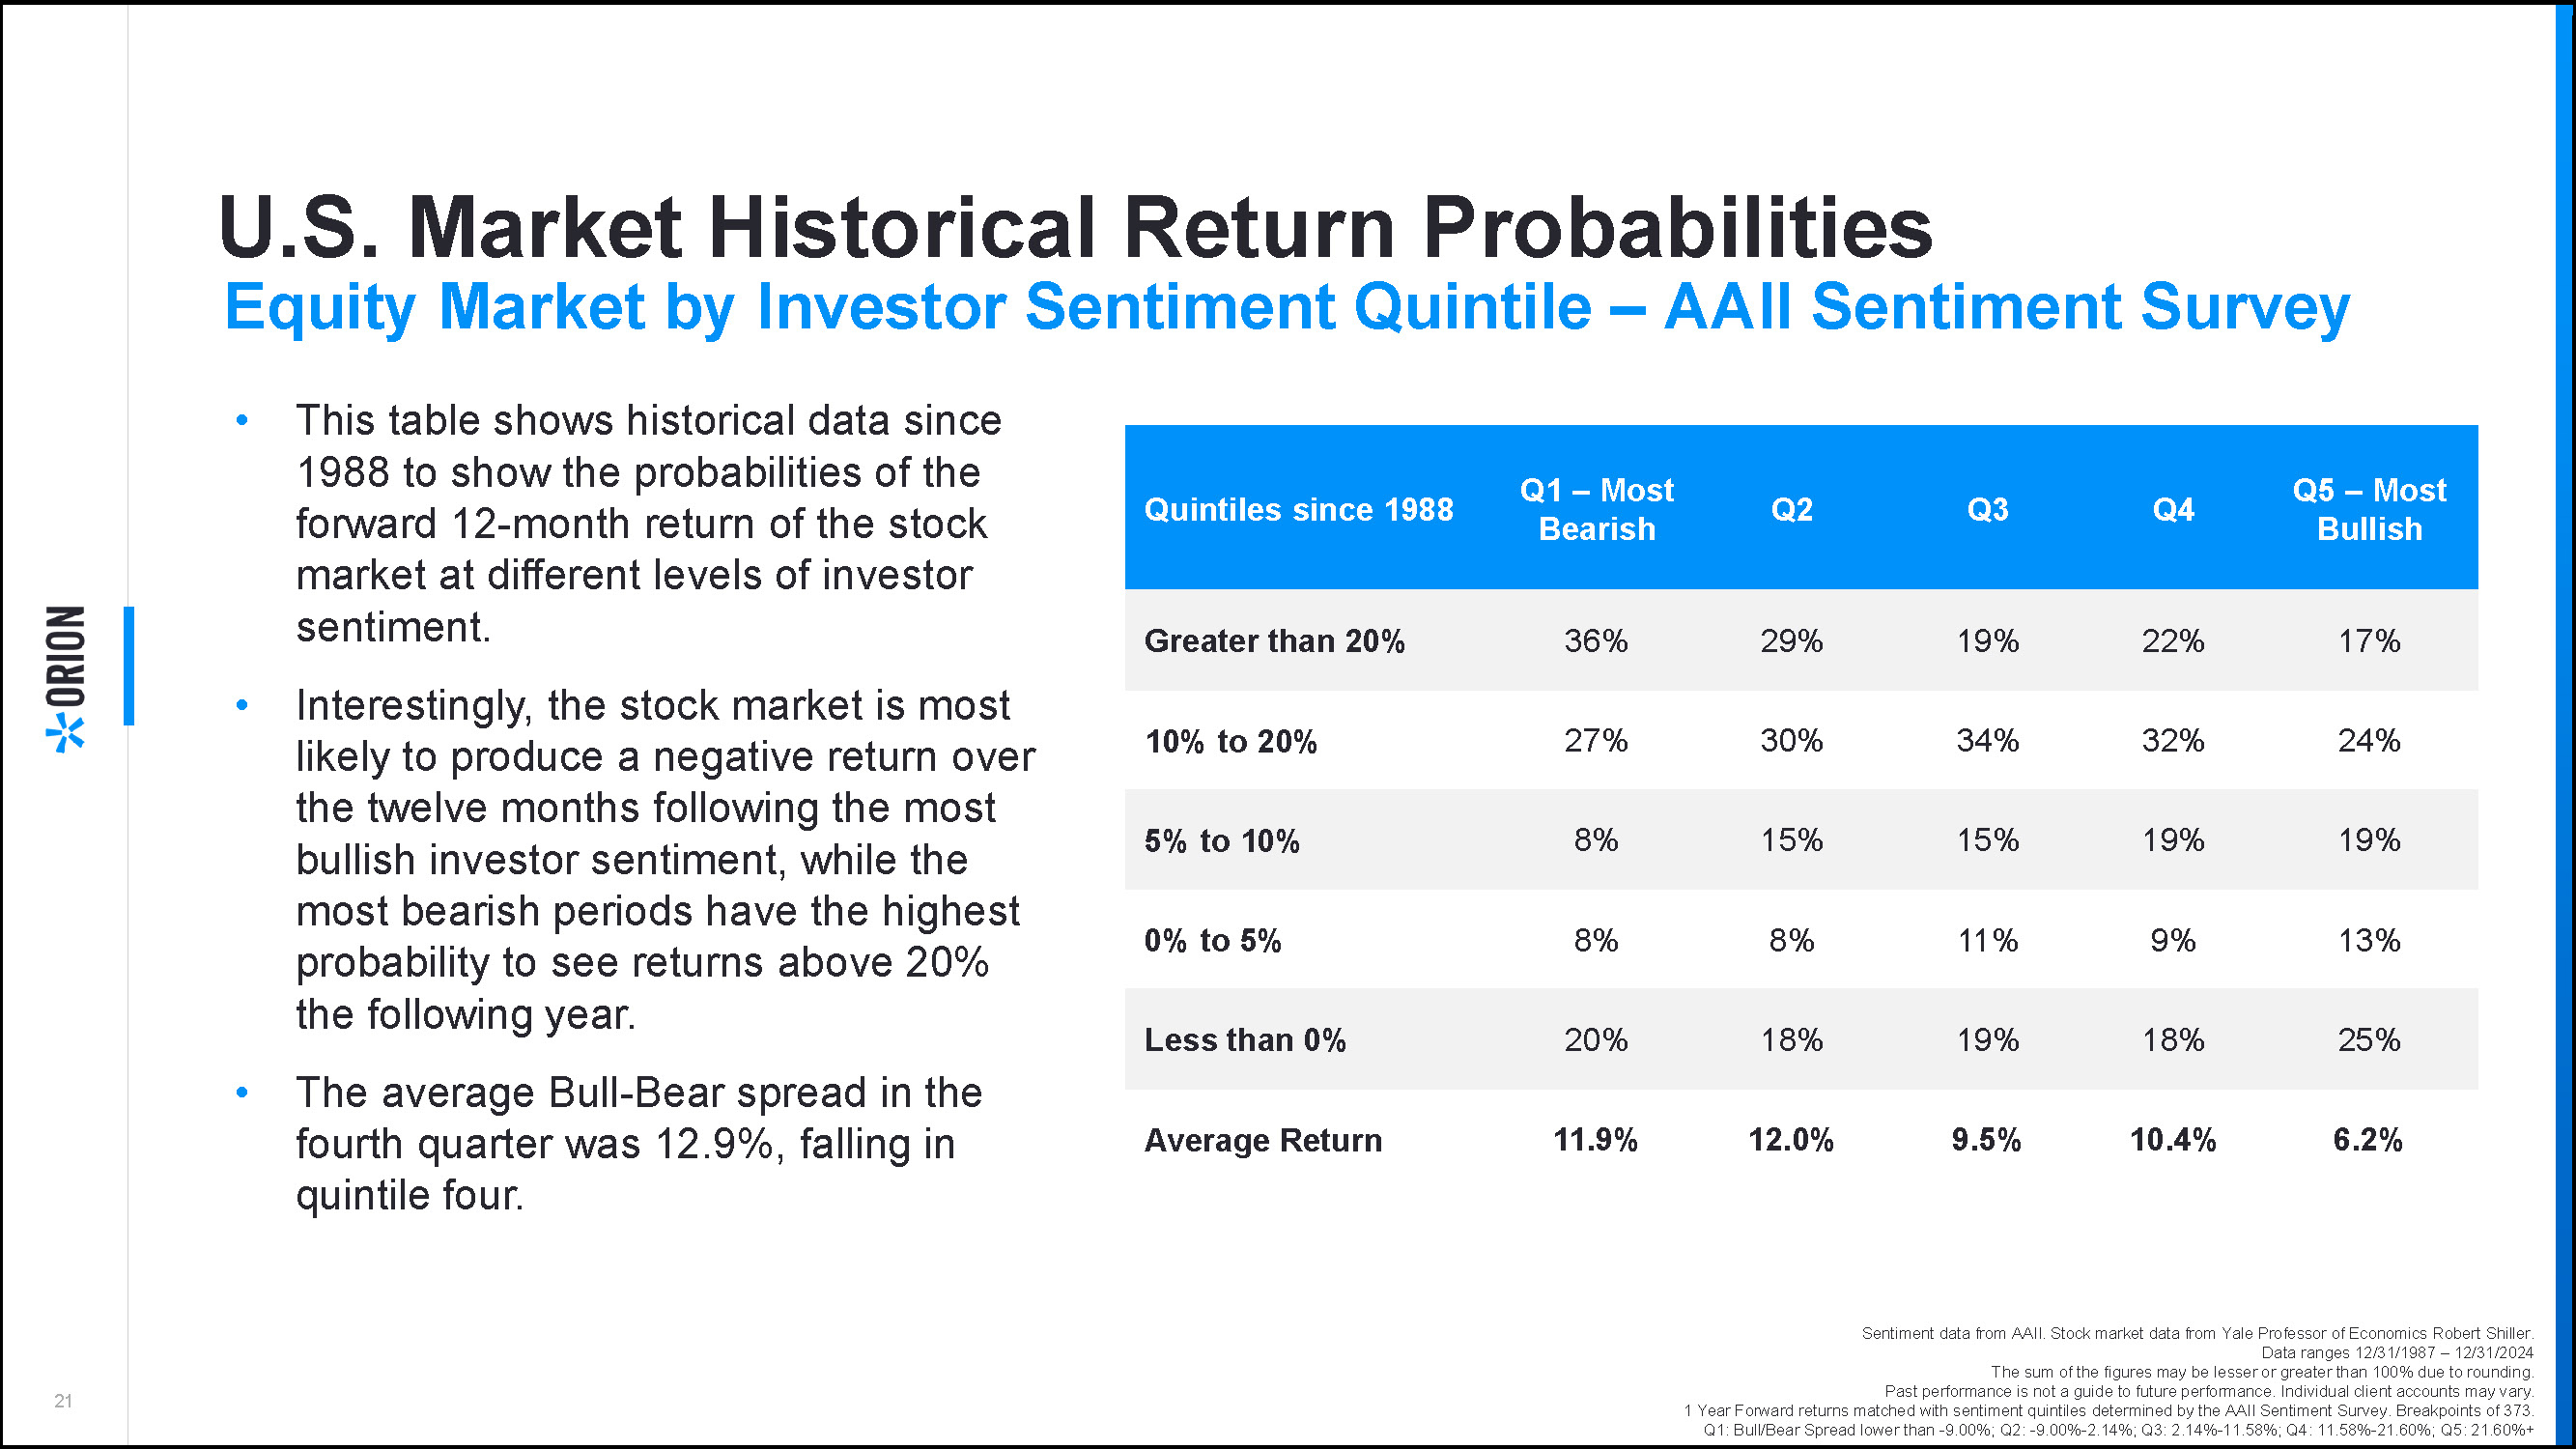
Looking at this chart, we took the bull/bear spread or how many survey respondents of that AAII survey were bullish minus the amount that were bearish and line those levels up with the forward twelve month returns on the S&P 500. And we did this all the way back to 1987 when the AAII survey started.
What we found is that when investors are the most bearish or where we are now, we generally see higher forward average returns than when investors are the most bullish with a spread of nearly 6%.
We can also compare this 11.9%/12% average return when investors are bearish to a simple average over this time of 9%. So you could say that when markets are the most bearish we actually get above average returns going forward.
Now, of course, market fundamentals and longer-term indicators are just as important to consider when analyzing where we could go next, but I hope this chart and this video gave you something to think about. Thanks again for watching, and as always, please let us at Orion know if there's anything we can do to help you and your clients. Thanks.