


As election season heats up, many long-term investors naturally wonder which candidate will be better for stock market returns in the years ahead. But is this the best question for long-term investors to focus on?
While the stock market does follow earnings over time, successful investing depends significantly on how much an investor pays for those earnings. When valuations are too high—meaning an investor is paying too much for a unit of fundamental value like revenue or earnings—it can hinder long-term returns. However, when valuations are low, it can set the stage for above-average returns and even offer a "margin of safety" if fundamentals underwhelm.
Despite numerous studies showing that one political party may outperform the other in the stock market, other factors, such as valuations, provide better insight into potential future returns.
In fact, when valuations are high heading into an election, returns tend to be below average over the next four years, regardless of which party wins. Conversely, when valuations are low, returns tend to be above average, again, regardless of the election’s outcome.
Research by Nolan Mauk at Brinker Capital examined presidential elections dating back to 1900, using the CAPE Ratio (often also known as the Shiller price/earnings ratio) as a valuation measure. The CAPE ratio, which averages real (ie. Inflation-adjusted) earnings per share over a 10-year period to smooth out cyclical fluctuations, has indeed shown a negative correlation with future S&P 500 returns, particularly in election years.
Mauk’s findings suggest:
- When the CAPE ratio is in its lowest quintile (indicating the market is most undervalued) during the fourth quarter of an election year, the subsequent four-year average annualized gain has been 15%.
- On the other hand, when the CAPE ratio is in its highest quintile (indicating the market is most overvalued), the following four years have seen an average annualized return of -1%.
- Interestingly, the S&P 500 tends to perform well in the first year of a new presidency but often underperforms thereafter.
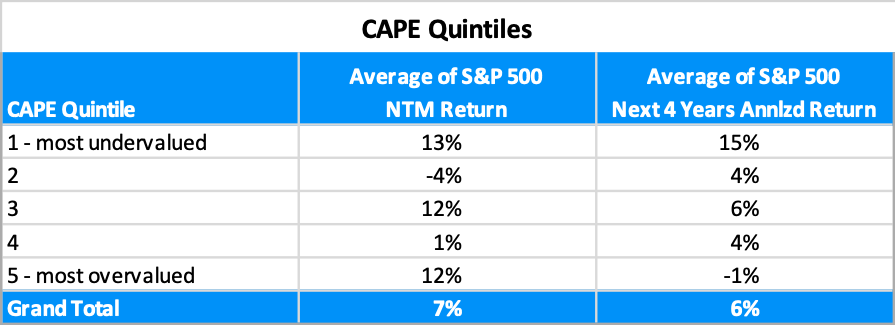
Average of S&P 500 NTM Return is the average return of the S&P 500 over the 12 months following the fourth quarter of an election year.
Average of S&P 500 Next 4 Years Annualized Return is the average return of the S&P 500 over the following 4 years (the next presidential term).
This highlights that starting valuations play a crucial role in shaping long-term return expectations, and this holds true in all market environments—not just during election years. The evidence indicates that valuations, rather than election outcomes, are often a more reliable factor for investors to consider when projecting stock market performance.