


Want to download the full In Case of Emergency deck?
Ryan: Ryan Dressel, Ben Vaske, and Nolan Mauk representing Orion's Investment Strategy Team here with you for an important update around recent market volatility.
As you know, markets have been whipsawed from March, April, and into May as we continue around trade uncertainty, economic uncertainty, and potential outcomes for investors that we think are important to communicate at this time. We have an important slide deck to share with you, that covers behavioral finance, market volatility, and some market history. So Ben, what is in this deck and why should advisors care, about this update?
Ben: Yeah. So I'll start off with the title of this deck, which is in case of emergency, open our favorite charts for times of market stress. And really what our goal here is is not to give you current events because we're all getting that in the news. Our goal is to provide you with some of our favorite slides that can help you with client conversations in times of market stress that can really be used at any time. So there's a few different sections here as Ryan just mentioned.
We've got first off, on average, markets go up more than they go down. So we've got a few studies just talking about the long term time horizon of staying invested in the market.
Second, we then break it down into kinda our mantra of stay invested, stay diversified, and stay disciplined. So on stay invested, we talk about, you know, those max drawdown days and how staying invested can actually help you rather than hurt you. In terms of stay diversified, we believe in globally diversified portfolios here. And so plenty of, research on using different asset classes and how different market cycles can react for portfolios. And then finally, stay disciplined, which is really much more focused on behavioral finance and how behavioral finance can help or hurt your clients over time.
Nolan, you've got a few favorites. Do you wanna kinda give us a rundown of what some of your favorite slides are?
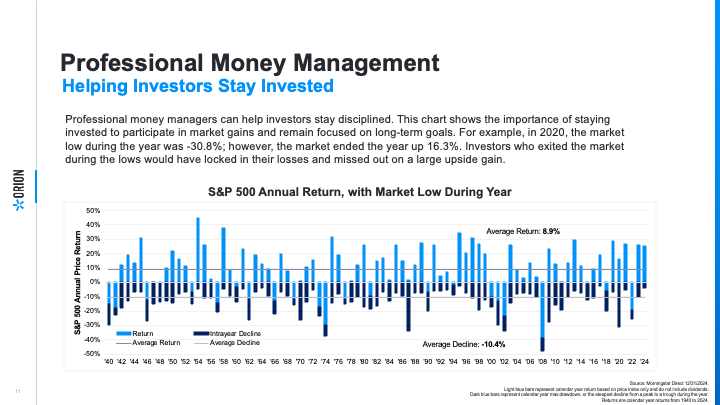
Nolan: Yeah. So, as you're going through, in the Stay Invested section, I think a good one to look at is the S&P 500 intra-year declines slide, which shows peak to trough the the worst S&P 500 decline throughout a calendar year, as well as the overall annual return for that year. Making the point that like we've just seen, you know, there are sharp selloffs, pretty frequently, in the markets, but those who are able to stay invested through them are the ones able to realize the rebound on the other end.
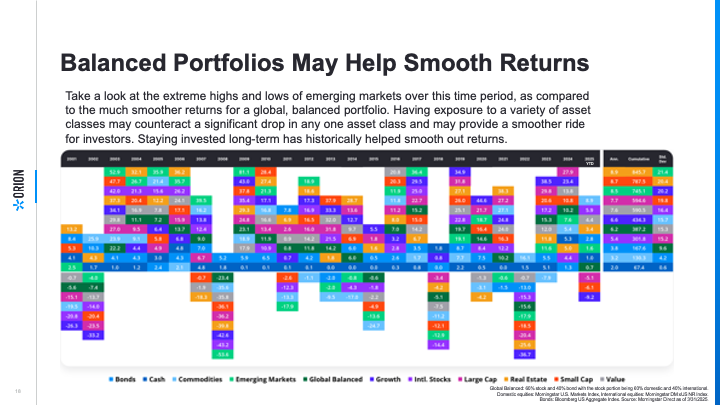
In the Stay Diversified section, that that first chart, we call it the quilt chart, is a good one to look at. It shows annual asset class returns year over year, basically making the point that different asset classes perform differently in different phases of the market cycle. And so a diversified blend of asset classes over time can help to smooth returns for portfolios.
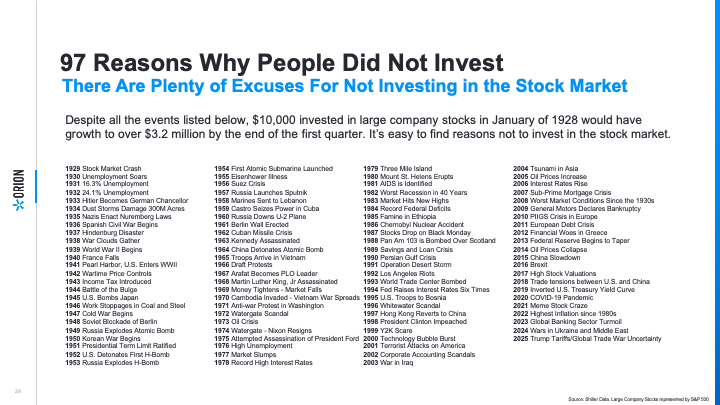
And then finally, in the Stay Disciplined section, a favorite of many advisers is the ninety seven reasons not to invest, providing back to 1929 a reason every single year why a rational person could have convinced themselves that now isn't the right time to get into the market, whether it be wars, natural disasters, you know, what have you. There's always a reason you can convince yourself to stay out of the market, but, you know, disciplined investors know that no matter what's going on on the outside, staying invested in time in the market is is gonna be the most beneficial over time.
So those are some of the some of the good ones to look out for as you go through this deck.
Ben: Great. Thank you. And thank you all for checking out this new deck. If you need any other content, please check out our new Market Volatility microsite. That's at Orion.com/market-volatility. And if there's anything that you need from us, please don't hesitate to reach out. Thank you.