Weekly Notes from Tim

By Tim Holland, CFA, Chief Investment Officer

  • A knock on the bull market – and we think we remain in the bull market that got going June 2023 when the S&P 500 closed up 20% from its October 2022 closing low of 3,670 even though the index did correct 21% from its then peak of 6,147 hit on February 19th of this year through April 7th as the index didn’t close down 20%, our criteria for a bear market – is that it has been narrow in scope, driven predominantly – almost exclusively – by large cap US growth stocks (think the “Magnificent 7,” including Nvidia, which to its credit topped $4 trillion in market capitalization last week, the first company to do so).    
     
  • And the argument is a fair one…if you look at returns from the Russell 1000 Growth Index, Russell 1000 Value Index and the S&P 500 on a trailing 3-, 5- and 10-year basis, US large cap growth stocks come out on top, and often by a very wide margin. And the same dynamic holds if you look at returns for the more diversified Russell 3000 Growth Index and Russell 3000 Value Index, and the S&P 500, over the same time periods.  
     
  • That said, we are looking at much more of a horse race between growth and value and the broader market on a trailing 1-year basis with the Russell 3000 Growth Index, the Russell 3000 Value Index and the S&P 500 up 12%, 11.6% and 11% respectively over that period (see chart). Said differently, the market, as volatile as it has been, has been broadening out a bit, with gains coming from other sectors than tech, other styles than growth and other sizes than large. Another data point that speaks to this development is that an equally weighted S&P 500 Index is up 6.5% in 2025 vs a return of 7.2% for the traditional market cap weighted S&P. Whether current performance patterns will hold, time will tell. If they do, they should prove to be a powerful tailwind for more diversified portfolios (joining the recent strong absolute and relative returns from overseas markets).  
     
Chart 1

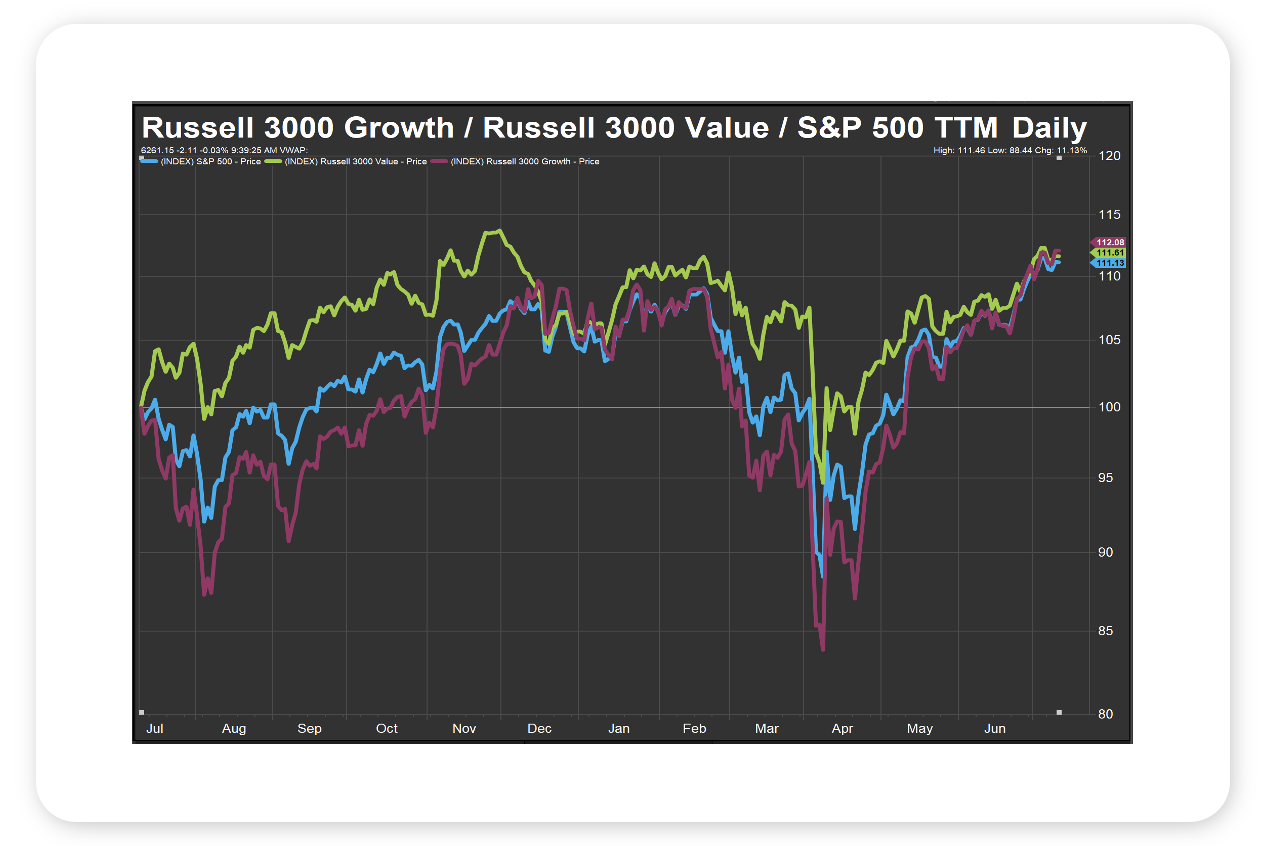
Data Source: FactSet, 7/9/2025


Looking Back, Looking Ahead

By Ben Vaske, BFA, Manager, Investment Strategy

Last Week

Global equities took a breather last week as tariffs made their way back to the headlines. The S&P 500 and NASDAQ 100 lost under half a percent each, while the blue-chip Dow Jones lost about 1% on the week. Longer term interest rates rose, and so did the dollar, pushing bond prices and international equities slightly lower as well. While the week was broadly in the red across asset classes, losses were modest. 

Despite the headlines and broad index drawdowns, the Mag 7 posted a positive week, led by a 3.5% gain from NVIDIA, which notably pushed the company to over $4T in market cap – the first publicly traded company to reach such a milestone. 

Throughout the week, US President Trump announced new tariff rates on over 20 countries as the end of the initial 90-day pause came to an end – the new unofficial deadline for tariffs to take effect is August 1st. Also notable, the US Treasury announced that tariff revenues allowed the US to post a budget surplus of $27B in June off the heels of a $316B deficit in May. 

The economic calendar last week was light, with the small business confidence (NFIB) index and Wholesales Inventories coming in right near expectations.  
 

This Week

As for this week, all eyes will be on the Consumer Price Index (CPI), set to be released on Tuesday 7/15 at 8:30a ET, especially as tariffs are once again front of mind. While we haven’t seen any notable price increases in the hard data to date, many are expecting that tariff duties will put upward pressure on inflation indicators. Additionally, the Producer Price Index (PPI) will be released Wednesday 7/16. 

US Retail Sales will be released on Thursday 7/17, giving us a glance at the health of the consumer. Considering that roughly 70% of US GDP is consumption driven, retail sales can serve as a leading indicator to the health of the overall economy, as well as serve as a gauge on consumer sentiment.  


We hope you have a great week. If there’s anything we can do to help you, please feel free to reach out to ben.vaske@orion.com or opsresearch@orion.com.
 

Get Your Own Market Commentary

Client-Friendly Weekly Wire

Want a version of Weekly Wire you can send directly to your clients? Subscribe to our Weekly Wire newsletter and get a client-friendly version every Monday. Simply download, add your firm's logo, and use with your clients!


Key Data

Stocks, Bonds, Alternatives, and Real Assets as of July 11, 2025

Security Name

Risk Score

1 Wk

1 Mo

QTD

YTD

1 Yr

3 Yr Ann.

Global Equities (60% US, 40% Intl)

100

-0.31%

2.94%

0.62%

11.62%

14.19%

17.58%

S&P 500 Total Return

102

-0.29%

4.05%

0.92%

7.18%

13.59%

19.34%

Dow Jones Industrial Average

97

-1.01%

3.63%

0.67%

5.25%

13.58%

14.74%

NASDAQ 100 Total Return

122

-0.37%

4.26%

0.47%

8.85%

13.57%

25.34%

TV Benchmark

107

-0.56%

3.98%

0.69%

7.10%

13.58%

19.81%

Morningstar US Large Cap

102

-0.25%

4.26%

0.78%

7.50%

13.94%

21.06%

Morningstar US Mid Cap

113

-0.78%

3.98%

0.97%

6.23%

14.41%

13.86%

Morningstar US Small Cap

125

-0.39%

4.16%

2.41%

3.18%

9.44%

12.23%

Morningstar US Value

98

-0.62%

3.41%

1.40%

7.31%

12.23%

13.38%

Morningstar US Growth

126

-0.52%

4.03%

-0.02%

8.38%

18.33%

19.69%

MSCI ACWI Ex USA

98

-0.25%

1.22%

0.08%

18.41%

14.09%

15.05%

MSCI EAFE

101

-0.23%

0.70%

-0.22%

19.66%

13.72%

16.83%

MSCI EM

98

-0.15%

2.18%

0.73%

16.42%

12.39%

11.10%

Bloomberg US Agg Bond Index

27

-0.37%

0.48%

-0.81%

3.18%

3.86%

2.20%

Bloomberg High Yield Corp Bond Index

41

-0.22%

1.24%

-0.02%

4.55%

9.28%

9.32%

Bloomberg Commodity Index

70

0.52%

0.98%

1.90%

7.54%

7.82%

0.93%

Wilshire Liquid Alternative Index

25

-0.29%

0.86%

-0.03%

2.63%

2.53%

4.36%

US Dollar

10

0.49%

-1.46%

0.80%

-9.99%

-7.04%

-3.00%

Bloomberg US Treasury Bill 1-3mo

1

0.09%

0.38%

0.16%

2.29%

4.75%

4.70%

Source: Morningstar

The TV Benchmark represents an average of the S&P 500, Dow Jones IA, and NASDAQ 100 return indexes. The Orion Risk Score represents risk relative to the global equity market.


Interest Rates as of July 11, 2025

Rate

This Week

1 Wk Δ%

13-Wk Treasury Yield

4.24%

0.00%

10-Yr Treasury Yield

4.42%

0.08%

Bloomberg US Agg Yield

4.71%

0.05%

Avg Money Mkt Yield

4.13%

-0.01%

Avg 30-Yr Mortgage Rate

6.70%

-0.10%

Sources: Yahoo Finance, S&P Global, Crane Data, BankRate


Key Economic Data Last Week

Data Point

Expectation

Actual

NFIB Optimism Index

98.7

98.6

Consumer Credit

$10.0B

$5.1B

Wholesale Inventories

0.3%

-0.3%

Monthly U.S. Federal Budget

-$20.5B

$27B

Source: MarketWatch,  First Trust


Key Economic Data This Week

Data Point

Expectation

Actual

Consumer Price Index (CPI) YoY

2.7%

7/15/25

Core CPI YoY

3.0%

7/15/25

Producer Price Index (PPI) YoY

--

7/16/25

Core PPI YoY

--

7/16/25

U.S. Retail Sales

0.2%

7/17/25

Import Price Index

0.3%

7/17/25

Housing Starts

1.30M

7/18/25

Source: MarketWatch

 
More Just for You

Want Resources for Your Clients?

Get a version of Weekly Wire you can send directly to your clients. Subscribe to our Weekly Wire newsletter and get a client-friendly version every Monday. Simply download, add your firm's logo, and use with your clients!

The views expressed herein are exclusively those of Orion Portfolio Solutions, LLC d/b/a Brinker Capital Investments, a registered Investment Advisor, and are not meant as investment advice and are subject to change. Information contained herein is derived from sources we believe to be reliable, however, we do not represent that this information is complete or accurate and it should not be relied upon as such. This information is prepared for general information only. It does not have regard to the specific investment objectives, financial situation, and the particular needs of any specific person.

An index is an unmanaged group of assets considered to be representative of a select segment or segments of the market in general, as determined by the index manager for the purposes of managing a specific index. You cannot invest directly in an index.

The CFA® is a globally respected, graduate-level investment credential established in 1962 and awarded by CFA Institute — the largest global association of investment professionals. To learn more about the CFA charter, visit www.cfainstitute.org.

Think2perform’s Behavioral Financial Advice program integrates traditional finance practices with psychology and neuroscience to improve emotional competency and decision-making behavior that increases effective usage of the financial plan with clients. To obtain the Behavioral Financial Advisor (BFA) designation, participants must complete a self-directed course, which takes 20-30 hours to complete, and includes a mix of interactive exercises, videos and case studies. To learn more about the BFA, visit https://www.think2perform.com.

Wealth Management services offered through Orion Portfolio Solutions, LLC d/b/a Brinker Capital Investments a registered investment advisor.