Weekly Notes from Tim

By Tim Holland, CFA, Chief Investment Officer

  • As in life, as in markets. If you don’t stop and look around once in a while, you could miss a lot…just consider the last four months for Wall Street.    
     
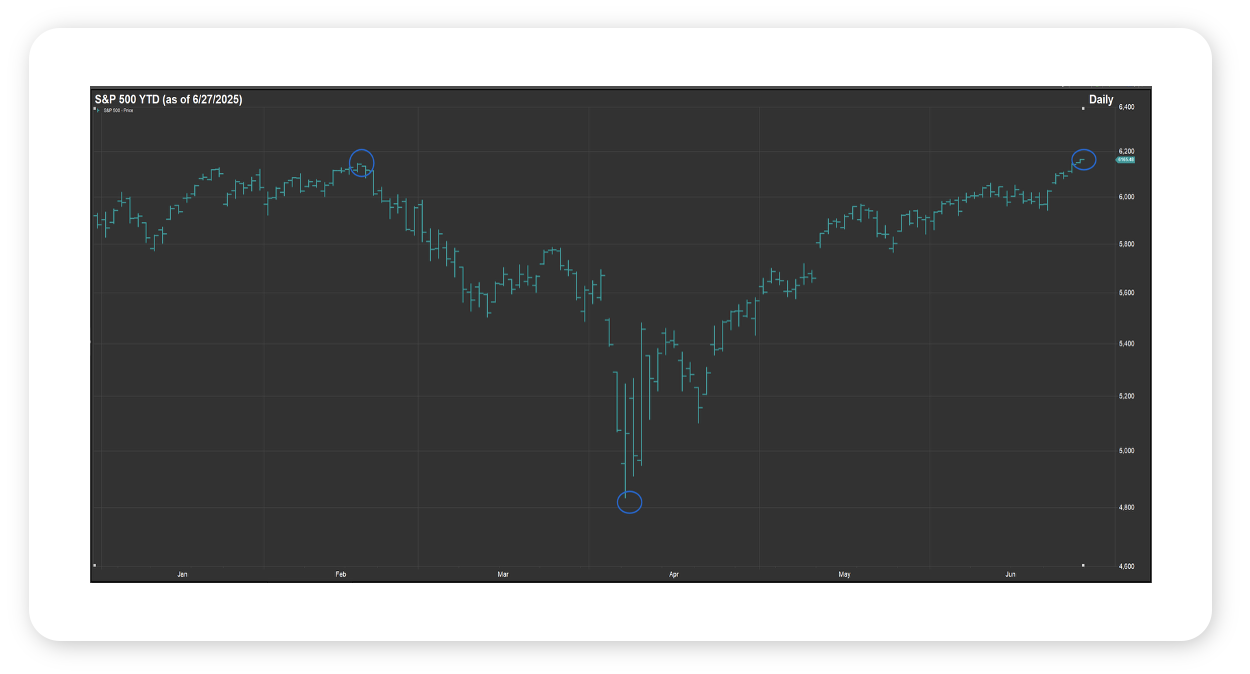
  • US equities – as measured by the S&P 500 – hit a record high of 6,147 on February 19th, spurred along by falling inflation, a rate cutting Fed, strong Q4 2024 earnings results and expectations for a pro-growth policy agenda from the new Trump Administration (see chart).  
     
  • Then, things moved south, quickly…among other blows, Wall Street was hit with hotter than expected inflation prints and signs of a softening jobs market, there was a focus on trade policy and tariffs from the Trump Administration that few investors anticipated (capped off by the baseline and reciprocal tariffs announced by President Trump on “Liberation Day” – April 2nd), and a Fed that moved decisively to the sidelines, primarily due to the concern that coming tariffs would drive inflation higher…at its worst, the S&P 500 fell 21.3% peak to trough, touching 4,835 on April 7th (see chart).  
     
  • And then the script flipped again…the White House announced a 90-day pause on reciprocal tariffs and walked back proposed tariffs on China, Wall Street got cooler than expected inflation prints and signs of a steadying jobs market, Q1 2025 earnings came in much better than expected – including from AI stalwart NVIDIA – and stocks started and continued a relentless march higher, with the S&P 500 rallying 28% to 6,188 on June 27th, a new all-time high (see chart). Not even a dramatic escalation of Middle East hostilities which saw the US target Iranian nuclear facilities or the very public disagreement over the best path forward for interest rates between President Trump and Fed Chair Jay Powell could knock the stock market off its stride.  
     
  • Now, with all due respect to Ferris Bueller and this week’s intro, I am guessing most of us were glued to the news these past few months and didn’t miss much if any of the market’s stomach-churning volatility. But here we are, and we will gladly take the rally, and we will take the market’s performance year-to-date as a reminder of both the benefits of taking a long-term view towards investing, and a reminder of the power and resiliency of the US economy. And on that note, we would like to wish you and your loved ones a very happy, safe and fun 4th of July and America a very Happy Birthday!!!  
     
Chart 1

Data Source: FactSet, 6/27/2025


Looking Back, Looking Ahead

By Ben Vaske, BFA, Senior Investment Strategist

Last Week

Global equities surged last week, and the S&P 500 reached a new all time high for the first time since February 18th. The index is now positive nearly 6% YTD after being off nearly 20% from its high. International equities still lead US in 2025, with the MSCI EAFE Index up nearly 20% YTD. Interest rates retreated on equity strength and rate cutting forecasts from the Fed, pushing fixed income indexes higher. The laggards for the week were commodities and the dollar. Oil prices fell sharply by over 10%, and gold prices retreated by over 3%. As for the economy, Q1 GDP was revised lower to a rate of -0.5% (relative to second estimate of -0.2%), while headline Personal Consumption Expenditures (PCE) came in slightly cooler than expected. Over the weekend, more developments were made in Congress pertaining to President Trump’s tax cutting mega-bill, which will need to face a final vote in the Senate and an additional vote in the House early this week to make it to the President’s desk by his self-imposed deadline of July 4th.  
 

This Week

This week is a short trading week as markets will close early on Thursday and be closed on Friday in observance of the 4th of July. We’ll be looking for any developments in Congress regarding the “Big Beautiful Bill”, as well as continuing to monitor geopolitical activity, which has been calmer since cease fires were announced. As for economic releases, manufacturing and services PMI’s will be released on Tuesday and Thursday, respectively, and nonfarm payrolls and the US unemployment rate will be released on Thursday.  


We hope you have a great week. If there’s anything we can do to help you, please feel free to reach out to ben.vaske@orion.com or opsresearch@orion.com.
 

Get Your Own Market Commentary

Client-Friendly Weekly Wire

Want a version of Weekly Wire you can send directly to your clients? Subscribe to our Weekly Wire newsletter and get a client-friendly version every Monday. Simply download, add your firm's logo, and use with your clients!


Key Data

Stocks, Bonds, Alternatives, and Real Assets as of June 27, 2025

Security Name

Risk Score

1 Wk

1 Mo

QTD

YTD

1 Yr

3 Yr Ann.

Global Equities (60% US, 40% Intl)

100

3.27%

3.92%

11.64%

10.58%

16.23%

16.36%

S&P 500 Total Return

102

3.45%

4.37%

10.36%

5.65%

14.11%

18.33%

Dow Jones Industrial Average

97

3.83%

3.68%

4.80%

3.89%

13.87%

13.94%

NASDAQ 100 Total Return

122

4.20%

5.31%

17.10%

7.65%

14.75%

24.38%

TV Benchmark

107

3.83%

4.45%

10.76%

5.73%

14.24%

18.88%

Morningstar US Large Cap

102

3.79%

4.88%

11.75%

6.08%

14.59%

20.10%

Morningstar US Mid Cap

113

2.24%

2.63%

7.27%

4.58%

14.62%

12.59%

Morningstar US Small Cap

125

2.64%

3.13%

7.25%

0.73%

10.25%

10.53%

Morningstar US Value

98

1.97%

2.85%

0.92%

5.40%

12.76%

12.17%

Morningstar US Growth

126

4.16%

5.57%

18.61%

7.65%

19.52%

19.06%

MSCI ACWI Ex USA

98

3.05%

3.27%

12.34%

18.36%

18.57%

13.65%

MSCI EAFE

101

3.11%

2.13%

12.02%

19.87%

18.32%

15.54%

MSCI EM

98

3.37%

6.03%

12.68%

16.07%

16.96%

9.50%

Bloomberg US Agg Bond Index

27

0.68%

1.55%

0.85%

3.65%

5.22%

2.77%

Bloomberg High Yield Corp Bond Index

41

0.81%

1.80%

3.27%

4.30%

10.08%

9.16%

Bloomberg Commodity Index

70

-3.53%

1.31%

-2.29%

6.39%

6.29%

-0.93%

Wilshire Liquid Alternative Index

25

0.79%

1.23%

1.59%

2.36%

3.08%

4.13%

US Dollar

10

-1.78%

-1.98%

-6.78%

-10.45%

-8.40%

-2.30%

Bloomberg US Treasury Bill 1-3mo

1

0.08%

0.39%

1.06%

2.12%

4.79%

4.66%

Source: Morningstar

The TV Benchmark represents an average of the S&P 500, Dow Jones IA, and NASDAQ 100 return indexes. The Orion Risk Score represents risk relative to the global equity market.


Interest Rates as of June 27, 2025

Rate

This Week

1 Wk Δ%

13-Wk Treasury Yield

4.20%

0.00%

10-Yr Treasury Yield

4.28%

-0.10%

Bloomberg US Agg Yield

4.61%

-0.12%

Avg Money Mkt Yield

4.10%

0.00%

Avg 30-Yr Mortgage Rate

6.87%

-0.02%

Sources: Yahoo Finance, S&P Global, Crane Data, BankRate


Key Economic Data Last Week

Data Point

Expectation

Actual

Consumer Confidence

98.4

93.0

New Home Sales

695,000

623,000

Q1 GDP (Second Revision)

-0.2%

-0.5%

Personal Consumption Expenditures (PCE) YoY

2.3%

2.2%

Core PCE YoY

2.6%

2.7%

Source: MarketWatch,  First Trust


Key Economic Data This Week

Data Point

Expectation

Actual

ISM Manufacturing PMI

48.6

7/1/25

ADP Employment

120,000

7/2/25

ISM Services PMI

50.5

7/3/25

U.S Employment Report

115,000

7/3/25

U.S. Unemployment Rate

4.3%

7/3/25

Source: MarketWatch

 
More Just for You

Want Resources for Your Clients?

Get a version of Weekly Wire you can send directly to your clients. Subscribe to our Weekly Wire newsletter and get a client-friendly version every Monday. Simply download, add your firm's logo, and use with your clients!

The views expressed herein are exclusively those of Orion Portfolio Solutions, LLC d/b/a Brinker Capital Investments, a registered Investment Advisor, and are not meant as investment advice and are subject to change. Information contained herein is derived from sources we believe to be reliable, however, we do not represent that this information is complete or accurate and it should not be relied upon as such. This information is prepared for general information only. It does not have regard to the specific investment objectives, financial situation, and the particular needs of any specific person.

An index is an unmanaged group of assets considered to be representative of a select segment or segments of the market in general, as determined by the index manager for the purposes of managing a specific index. You cannot invest directly in an index.

The CFA® is a globally respected, graduate-level investment credential established in 1962 and awarded by CFA Institute — the largest global association of investment professionals. To learn more about the CFA charter, visit www.cfainstitute.org.

Think2perform’s Behavioral Financial Advice program integrates traditional finance practices with psychology and neuroscience to improve emotional competency and decision-making behavior that increases effective usage of the financial plan with clients. To obtain the Behavioral Financial Advisor (BFA) designation, participants must complete a self-directed course, which takes 20-30 hours to complete, and includes a mix of interactive exercises, videos and case studies. To learn more about the BFA, visit https://www.think2perform.com.

Wealth Management services offered through Orion Portfolio Solutions, LLC d/b/a Brinker Capital Investments a registered investment advisor.