Weekly Notes from Tim

By Tim Holland, CFA, Chief Investment Officer

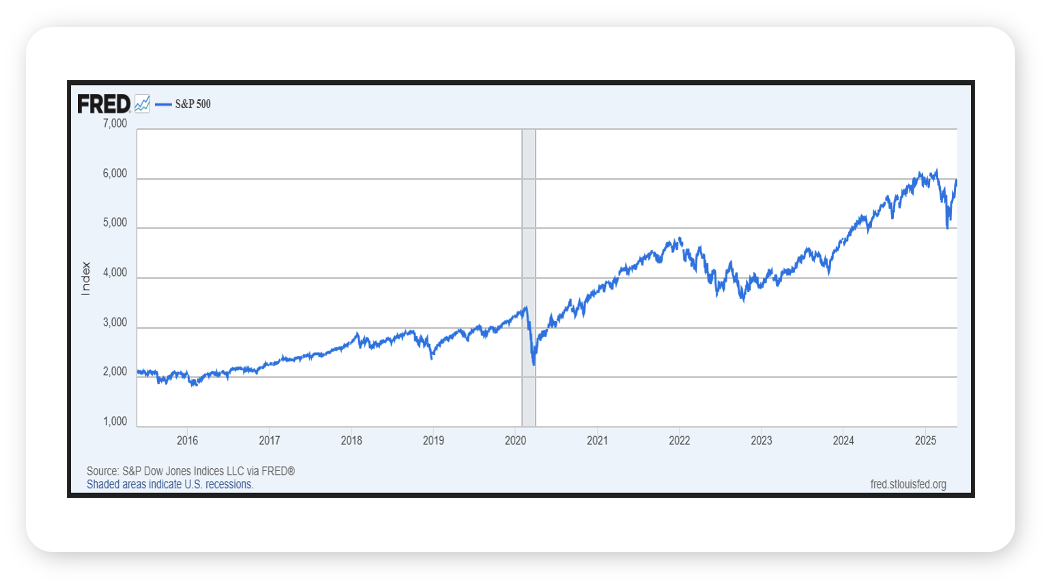
  • After hitting its all-time peak of 6,147 on February 19th, the S&P 500 spent the next six weeks falling 21% to 4,835, where it troughed on April 7th. Since then, the S&P 500 has rallied 21% (see chart, lower left). While many Wall Streeters would likely cite President Trump’s April 9th announcement of a 90-day pause on most reciprocal tariffs as the key catalyst for the recent rally, we find it interesting that the stock market troughed a full two days before that news hit (if there is a crystal ball out there that works, we think its risk assets, and the tendency for markets to trough or peak before the fundamental data that justifies such inflection points presents itself). Either way, we will gladly accept the move higher in the stock market.
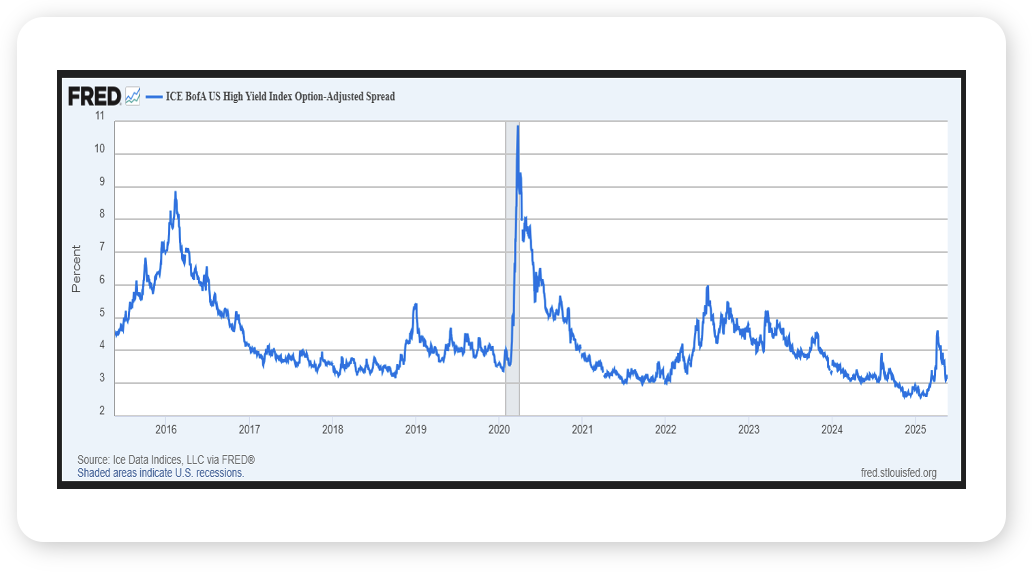
  • Some prognosticators think the market has gotten ahead of itself, considering trade hasn’t been solved for; Congress has not addressed the expected extension of the 2017 Tax Cut & Jobs Act, and the impact of policy uncertainty on the economy is not yet known. More recently, there are rising concerns over the USA’s fiscal health, and what that might mean for US government bonds (a topic we will dig into over the coming days). And while traditional fixed income has sold off over the past month, it’s been a different story for bonds issued by more levered, and thus in theory, riskier, companies (think high yield, or “junk” bonds). The incremental spread or yield those companies must offer investors to compel them to purchase their bonds spiked in April as trade uncertainty spiked but has since fallen back to near all-time lows (see chart, lower right; interestingly, those spreads peaked the same day the S&P 500 troughed). One way to interpret that move lower in spreads is that – broadly speaking – high yield investors are not, at least as of now, that worried about the outlook for the companies they have lent to, which is another way of saying they are not that worried about the outlook for the economy. Given the still uncertain world we are living in, that is another data point we will gladly accept. 

    Peaks & Troughs Chart 1
    Peaks & Troughs Chart 2

Source: Federal Reserve Bank of St. Louis, May 22, 2025 


Looking Back, Looking Ahead

By Ben Vaske, BFA, Senior Investment Strategist

Last Week

US equity markets took a step back last week. The S&P 500, Dow Jones, and NASDAQ 100 all lost over 2%. On Wednesday, the 20Y Treasury Auction saw very light demand, causing yields to surge as equities and bonds sold off. The S&P 500 lost about 1% for the day, contributing significantly to its weekly loss. More tariff threats came out of Washington as well, with US President Donald Trump expressing a 50% tariff on European Union goods, as well a potential 25% tariff on Apple iPhones not produced in the US. Additionally, markets came into the week digesting the news that Moody’s had downgraded the US’s credit, putting further upward pressure on yields. 
 

This Week

It’s a big week for earnings this week, as NVIDIA is set to release Q1 results after the close on Wednesday. Given the company’s concentration in the S&P 500 and close ties to the AI/tech trade, we expect the release to have a decent contribution to market returns for the day. In addition to earnings, we’ll see the release of the first revision of Q1 GDP, which initially came in at -0.3% and is expected to be unchanged – as a reminder, the first quarter print came in negative due to the negative effect of sharply lower net exports from tariff preparation. Personal Consumption Expenditures (PCE) will also be released this week, giving us, and the Fed, another glimpse at inflation. Coming off a lighter that expected CPI print, doves will be hoping for a lower print on PCE as well to push the Fed toward lower rates.  


We hope you have a great week. If there’s anything we can do to help you, please feel free to reach out to ben.vaske@orion.com or opsresearch@orion.com.
 

Get Your Own Market Commentary

Client-Friendly Weekly Wire

Want a version of Weekly Wire you can send directly to your clients? Subscribe to our Weekly Wire newsletter and get a client-friendly version every Monday. Simply download, add your firm's logo, and use with your clients!


Key Data

Stocks, Bonds, Alternatives, and Real Assets as of May 23, 2025

Security Name

Risk Score

1 Wk

1 Mo

QTD

YTD

1 Yr

3 Yr Ann.

Global Equities (60% US, 40% Intl)

100

-1.45%

5.57%

5.88%

4.87%

11.73%

12.84%

S&P 500 Total Return

102

-2.58%

8.08%

3.61%

-0.82%

11.64%

15.20%

Dow Jones Industrial Average

97

-2.43%

5.20%

-0.70%

-1.56%

8.39%

11.46%

NASDAQ 100 Total Return

122

-2.38%

11.98%

8.61%

-0.16%

13.18%

21.24%

TV Benchmark

107

-2.47%

8.42%

3.84%

-0.85%

11.07%

15.97%

Morningstar US Large Cap

102

-2.44%

8.69%

4.31%

-0.98%

12.67%

16.85%

Morningstar US Mid Cap

113

-3.16%

6.81%

2.70%

0.12%

8.85%

9.83%

Morningstar US Small Cap

125

-3.57%

6.95%

1.75%

-4.43%

4.09%

7.96%

Morningstar US Value

98

-2.52%

2.26%

-3.28%

1.01%

8.08%

9.28%

Morningstar US Growth

126

-2.95%

12.58%

9.90%

-0.25%

15.04%

16.48%

MSCI ACWI Ex USA

98

0.91%

6.78%

8.18%

13.98%

12.62%

10.82%

MSCI EAFE

101

1.34%

6.61%

8.65%

16.26%

12.60%

12.33%

MSCI EM

98

-0.06%

7.17%

6.89%

10.10%

10.52%

7.56%

Bloomberg US Agg Bond Index

27

-0.45%

-0.24%

-1.19%

1.56%

4.64%

1.43%

Bloomberg High Yield Corp Bond Index

41

-0.47%

1.39%

0.91%

1.93%

8.44%

7.61%

Bloomberg Commodity Index

70

1.81%

0.92%

-2.87%

5.75%

2.37%

-3.78%

Wilshire Liquid Alternative Index

25

-0.27%

1.70%

-0.05%

0.70%

1.82%

3.08%

US Dollar

10

-1.96%

-0.73%

-4.89%

-8.64%

-5.70%

-0.98%

Bloomberg US Treasury Bill 1-3mo

1

0.09%

0.38%

0.66%

1.71%

4.91%

4.53%

Source: Morningstar

The TV Benchmark represents an average of the S&P 500, Dow Jones IA, and NASDAQ 100 return indexes. The Orion Risk Score represents risk relative to the global equity market.


Interest Rates as of May 23, 2025

Rate

This Week

1 Wk Δ%

13-Wk Treasury Yield

4.23%

-0.01%

10-Yr Treasury Yield

4.51%

0.07%

Bloomberg US Agg Yield

4.87%

0.06%

Avg Money Mkt Yield

4.11%

0.00%

Avg 30-Yr Mortgage Rate

6.95%

0.11%

Sources: Yahoo Finance, S&P Global, Crane Data, BankRate


Key Economic Data Last Week

Data Point

Expectation

Actual

U.S. Leading Economic Indicators

-0.9%

-1.0%

S&P Flash U.S. Services PMI

50.8

52.3

S&P Flash U.S. Manufacturing PMI

49.8

52.3

Existing Home Sales

4.12M

4.0M

New Home Sales

695,000

743,000

Source: MarketWatch,  First Trust


Key Economic Data This Week

Data Point

Expectation

Release Date

Durable Goods Orders

-7.8%

5/27/25

Consumer Confidence

86.0

5/27/25

Q1 GDP (First Revision)

-0.3%

5/29/25

Pending Home Sales

-0.4%

5/29/25

Personal Income

0.3%

5/30/25

Consumer Spending

0.2%

5/30/25

Personal Consumption Expenditures (PCE) YoY

2.2%

5/30/25

Core PCE YoY

2.6%

5/30/25

Source: MarketWatch

 
More Just for You

Want Resources for Your Clients?

Get a version of Weekly Wire you can send directly to your clients. Subscribe to our Weekly Wire newsletter and get a client-friendly version every Monday. Simply download, add your firm's logo, and use with your clients!

The views expressed herein are exclusively those of Orion Portfolio Solutions, LLC d/b/a Brinker Capital Investments, a registered Investment Advisor, and are not meant as investment advice and are subject to change. Information contained herein is derived from sources we believe to be reliable, however, we do not represent that this information is complete or accurate and it should not be relied upon as such. This information is prepared for general information only. It does not have regard to the specific investment objectives, financial situation, and the particular needs of any specific person.

An index is an unmanaged group of assets considered to be representative of a select segment or segments of the market in general, as determined by the index manager for the purposes of managing a specific index. You cannot invest directly in an index.

The CFA® is a globally respected, graduate-level investment credential established in 1962 and awarded by CFA Institute — the largest global association of investment professionals. To learn more about the CFA charter, visit www.cfainstitute.org.

Think2perform’s Behavioral Financial Advice program integrates traditional finance practices with psychology and neuroscience to improve emotional competency and decision-making behavior that increases effective usage of the financial plan with clients. To obtain the Behavioral Financial Advisor (BFA) designation, participants must complete a self-directed course, which takes 20-30 hours to complete, and includes a mix of interactive exercises, videos and case studies. To learn more about the BFA, visit https://www.think2perform.com.

Wealth Management services offered through Orion Portfolio Solutions, LLC d/b/a Brinker Capital Investments a registered investment advisor.