Weekly Notes from Tim

By Tim Holland, CFA, Chief Investment Officer

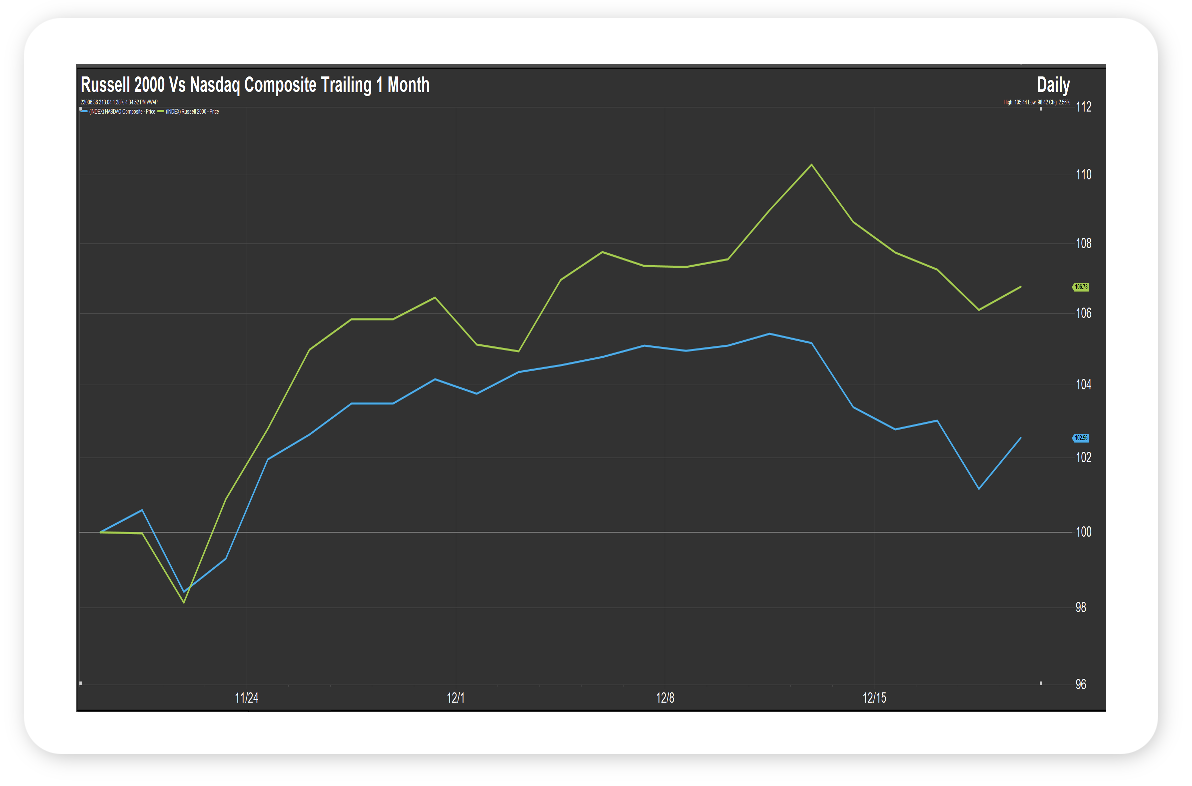
  • We bring a long-term view to the markets and the economy at Orion, doing our best to remember the importance and power of staying invested and letting time and compounding work to the benefit of the advisors – and their clients – that we are fortunate to serve. That said, we do pay attention to near term developments in the markets and economy, and try to determine, when appropriate, what those developments might mean for the markets and economy long-term. Which brings us to the focus of this week’s note – the recent outperformance of the Russell 2000 Index vs the NASDAQ Composite Index.
     
  • As you know, the Russell 2000 is the benchmark for US small cap stocks, while the NASDAQ Composite is made up of the 3,000 or so companies that trade on the NASDAQ. Both are market capitalization weighted, which means bigger companies matter more for both indices, which in the case of the NASDAQ means that large cap tech generally and the Magnificent 7 specifically have an outsized impact on performance. And as it concerns performance, over the past month the Russell has easily outdistanced the NASDAQ, up 6.8% vs 2.6% (through 12/18; see chart).
     
  • As to why small cap stocks have done so well on a relative – and absolute – basis of late, we would call out recent rate cuts by the Fed, labor market data that indicates the US economy remains on firm footing, and attractive valuation. As to why the NASDAQ – really, large tech – has lagged on a relative basis of late, we would call out ongoing concerns over valuation and an AI bubble, a few disappointing quarterly earnings reports and, maybe, investors taking some chips off the table after an extended period of exceptional performance (consider that the NASDAQ Composite is up 154% over the past two years).
     
  • As to what the near-term outperformance of small cap stocks might mean for the markets long-term, it could be a sign the US bull market – which has been propelled along by large cap tech stocks – is broadening out to include companies that haven’t caught a meaningful bid these past few years, a potentially very positive development. And for a much more articulate take on this topic, I recommend my colleague Nolan Mauk’s recent blog post, which can be found here…..Finally, on behalf of everyone at Orion, we wish you and your loved ones Happy Holidays! 
     
Picture 1

Source: FactSet, December 2025


Looking Back, Looking Ahead

By Ben Vaske, BFA, Manager, Investment Strategy

Last Week

Markets were mixed, with leadership rotating back toward U.S. large cap growth. Strength in growth stocks was enough to offset weakness in value and international equities in balanced portfolios. Emerging markets pulled back by about 1.5% but remain the top performing equity asset class YTD.

Global equities finished slightly negative. Both developed and emerging markets remain up over 30% YTD, outperforming U.S. equities by more than 13%. Real assets declined modestly following the softer inflation data, though commodities are still up close to 15% YTD, driven largely by precious metals.

Inflation surprised to the downside. The Consumer Price Index slowed sharply to 2.7% year over year versus expectations of 3.1%. Month over month readings were missing due to missing October data from the government shutdown, but the year over year deceleration reinforced the broader disinflation trend.

Interest rates fell across the curve, providing a tailwind for bonds. Investment grade fixed income gained roughly 34 bps on the week and is now up over 7% YTD, on pace for its best year since 2020. Money market yields dropped 12 bps as ultrashort rates adjusted to recent Fed cuts, increasing the opportunity cost of holding cash.

Consumer stress became more visible. The University of Michigan Consumer Sentiment Survey fell to an all-time low of 50.4, reflecting affordability pressures and a softening labor market. At the same time, household cash allocations climbed above 7% of financial assets, the highest level since 1950, just as yields on cash continue to fall.
 

This Week

It is a quiet, holiday shortened week. Markets will close early Wednesday and remain closed Thursday for Christmas, which should keep volatility muted.

The primary focus will be the delayed first estimate of Q3 GDP, expected to show growth around 3.2% to 3.5%. The release has been postponed since October due to the government shutdown and will help clarify the broader growth backdrop heading into year end.

We hope you have a great week. If there’s anything we can do to help you, please feel free to reach out to ben.vaske@orion.com or opsresearch@orion.com.
 

Get Your Own Market Commentary

Client-Friendly Weekly Wire

Want a version of Weekly Wire you can send directly to your clients? Subscribe to our Weekly Wire newsletter and get a client-friendly version every Monday. Simply download, add your firm's logo, and use with your clients!


Key Data

Stocks, Bonds, Alternatives, and Real Assets as of December 19, 2025

Security Name

Risk Score

1 Wk

1 Mo

QTD

YTD

1 Yr

3 Yr Ann.

Global Equities (60% US, 40% Intl)

100

-0.05%

3.51%

2.85%

22.79%

23.17%

20.75%

S&P 500 Total Return

102

0.13%

3.02%

2.46%

17.66%

17.99%

23.18%

Dow Jones Industrial Average

97

-0.64%

4.59%

4.18%

15.09%

15.64%

15.88%

NASDAQ 100 Total Return

122

0.60%

2.95%

2.85%

21.47%

20.92%

32.79%

TV Benchmark

107

0.03%

3.52%

3.16%

18.07%

18.19%

23.95%

Morningstar US Large Cap

102

0.21%

2.66%

2.68%

19.39%

19.49%

25.84%

Morningstar US Mid Cap

113

-0.38%

4.21%

0.48%

10.66%

11.40%

14.43%

Morningstar US Small Cap

125

0.06%

7.32%

4.65%

13.86%

14.32%

15.59%

Morningstar US Value

98

-0.48%

4.17%

3.95%

17.00%

18.70%

14.79%

Morningstar US Growth

126

0.62%

3.24%

-0.82%

14.92%

13.93%

25.21%

MSCI ACWI Ex USA

98

-0.28%

3.93%

3.49%

31.06%

31.54%

17.60%

MSCI EAFE

101

0.05%

4.41%

3.58%

30.22%

28.01%

17.50%

MSCI EM

98

-1.51%

0.84%

2.04%

30.84%

30.19%

15.97%

Bloomberg US Agg Bond Index

27

0.34%

0.39%

0.90%

7.09%

7.31%

4.05%

Bloomberg High Yield Corp Bond Index

41

0.22%

1.14%

0.95%

8.24%

8.53%

9.54%

Bloomberg Commodity Index

70

-0.09%

0.41%

4.87%

14.70%

17.50%

4.04%

Wilshire Liquid Alternative Index

25

-0.76%

0.21%

0.42%

6.13%

5.36%

5.46%

MSCI US REIT

104

-0.52%

-0.01%

-2.31%

2.29%

4.84%

8.36%

US Dollar

10

0.08%

-1.13%

0.67%

-9.27%

-8.89%

-2.04%

Bloomberg US Treasury Bill 1-3mo

1

0.07%

0.36%

0.91%

4.18%

4.34%

4.92%

Source: Morningstar

The TV Benchmark represents an average of the S&P 500, Dow Jones IA, and NASDAQ 100 return indexes. The Orion Risk Score represents risk relative to the global equity market.


Interest Rates as of December 19, 2025

Rate

This Week

1 Wk Δ%

13-Wk Treasury Yield

3.52%

-0.01%

10-Yr Treasury Yield

4.15%

-0.04%

Bloomberg US Agg Yield

4.33%

-0.06%

Avg Money Mkt Yield

3.58%

-0.12%

Avg 30-Yr Mortgage Rate

6.29%

0.02%

Sources: Yahoo Finance, S&P Global, Crane Data, BankRate


Key Economic Data Last Week

Data Point

Expectation

Actual

US Nonfarm Payrolls (delayed report)

45,000

64,000

US Unemployment Rate (delayed report)

4.5%

4.6%

US Retail Sales (Oct.)

0.1%

0.0%

Consumer Price Index (CPI) YoY

3.1%

2.7%

Core CPI YoY

3.0%

2.6%

Existing Home Sales

4.1M

4.1M

Source: MarketWatch


Key Economic Data This Week

Data Point

Expectation

Release Date

Third Quarter GDP (Delayed Report)

3.2%

12/23/25

Durable Goods Orders (Delayed Report)

-1.1%

12/23/25

Consumer Confidence

91.7

12/23/25

Source: MarketWatch

 
More Just for You

Want Resources for Your Clients?

Get a version of Weekly Wire you can send directly to your clients. Subscribe to our Weekly Wire newsletter and get a client-friendly version every Monday. Simply download, add your firm's logo, and use with your clients!

The views expressed herein are exclusively those of Orion Portfolio Solutions, LLC d/b/a Brinker Capital Investments, a registered Investment Advisor, and are not meant as investment advice and are subject to change. Information contained herein is derived from sources we believe to be reliable, however, we do not represent that this information is complete or accurate and it should not be relied upon as such. This information is prepared for general information only. It does not have regard to the specific investment objectives, financial situation, and the particular needs of any specific person.

An index is an unmanaged group of assets considered to be representative of a select segment or segments of the market in general, as determined by the index manager for the purposes of managing a specific index. You cannot invest directly in an index.

The CFA® is a globally respected, graduate-level investment credential established in 1962 and awarded by CFA Institute — the largest global association of investment professionals. To learn more about the CFA charter, visit www.cfainstitute.org.

Think2perform’s Behavioral Financial Advice program integrates traditional finance practices with psychology and neuroscience to improve emotional competency and decision-making behavior that increases effective usage of the financial plan with clients. To obtain the Behavioral Financial Advisor (BFA) designation, participants must complete a self-directed course, which takes 20-30 hours to complete, and includes a mix of interactive exercises, videos and case studies. To learn more about the BFA, visit https://www.think2perform.com.

Wealth management services provided by Orion Portfolio Solutions, LLC (“OPS”), a registered investment advisor. Orion OCIO services provided by TownSquare Capital, LLC (“TSC”), a registered investment advisors. OPS and TSC are affiliates and wholly owned subsidiaries of Orion Advisor Solutions, Inc.