Weekly Notes from Tim

By Tim Holland, CFA, Chief Investment Officer

  • Several clients have brought up gold of late, specifically its very strong performance in 2025…the commodity is up 40% or so year to date. Given its long history as a medium of exchange and a store of value, I find gold a fascinating topic from an investment point of view, though like many investors I struggle to determine its worth as it generates no earnings, cash flow or dividends (which makes it difficult for me to value).  
     
  • By most accounts one of the major tailwinds for gold this year has been a declining dollar…since gold is priced in dollars as the dollar weakens relative to other currencies it becomes cheaper to purchase in those currencies, boosting demand. And if the dollar is dropping due to concerns about the macroeconomic or geopolitical environment gold’s status as a “safe haven” asset can also put a bid under the commodity.  
     
  • But the focus of this week’s note isn’t on gold but on another asset class that has historically benefitted from a falling dollar and seems to be doing so again this year, international stocks (for a deeper dive on gold, I suggest the excellent blog post by my colleague Nolan Mauk…you can find it here… ).  
     
  • Year to date, the iShares MSCI ACWI EX US ETF (an ETF of large and mid cap international stocks) is up 26% while the ICE US Dollar Index is off 10% (see chart). A declining dollar is a boost for international markets in two ways…for those countries that borrowed in dollars, debt service becomes less expensive, and for US investors holding ex-US stocks, those positions are worth more in dollars as the dollar drops, which likely pulls more US capital into international stocks, pushing those markets higher still (for a deeper dive on international markets, I suggest the excellent blog post by my colleague Ben Vaske…you can find it here… ).  
     
  • Our team upgraded and went overweight international equities earlier this year. There is more than one way for US investors to benefit from a declining US dollar.  
     
Picture 1

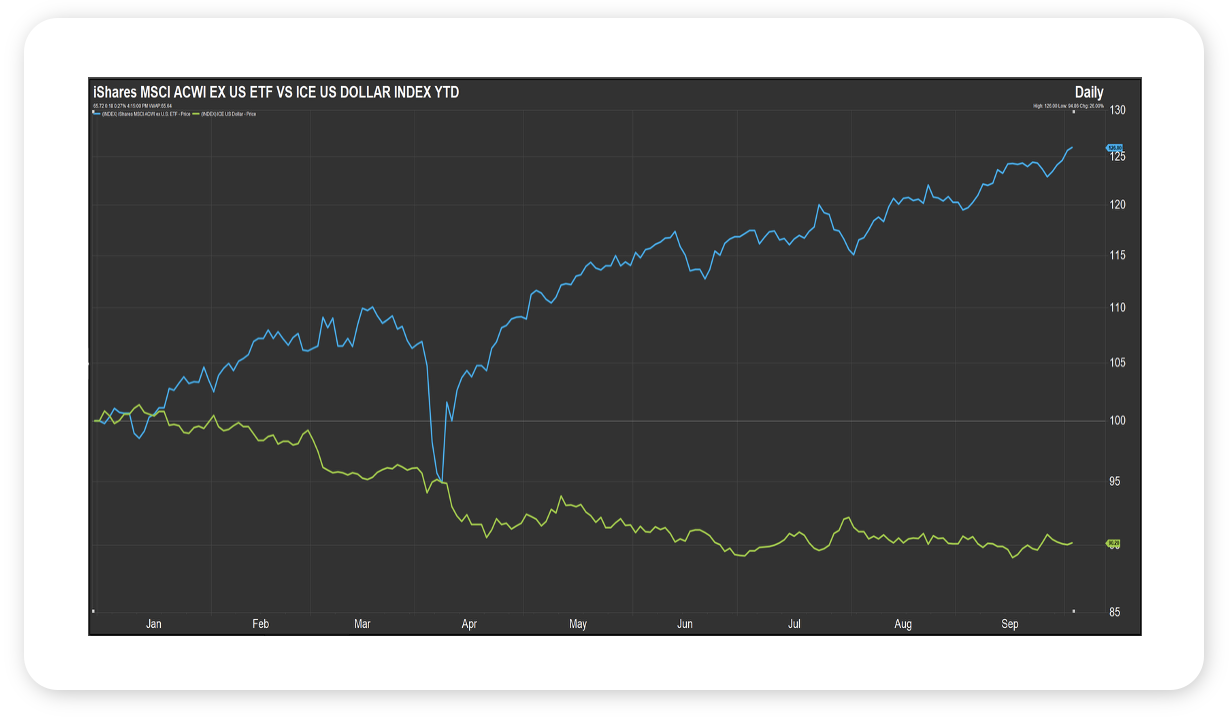
Source: FactSet, September 2025  


Looking Back, Looking Ahead

By Ben Vaske, BFA, Manager, Investment Strategy

Last Week

Markets held firm despite ongoing political turbulence in Washington. The federal government officially shut down after lawmakers failed to reach a funding deal. Still, global equities gained nearly 2% on the week, with emerging markets leading at +4%. Major U.S. indexes were also positive, led by small caps, which are now up more than 10% year-to-date. Bonds and real assets were modestly higher, and Bitcoin surged to a new all-time high as confidence in the U.S. government softened.

September closed out a strong stretch for diversified portfolios. Silver gained 15% for the month and 28% for the quarter, while Gold rose 11% and 16% over the same periods. Chinese equities added 10% in September, continuing their recovery. Tech stocks also performed well, with the Mag 7 gaining 8% for the month and 17% in Q3.

Economic data last week was mostly positive, but there were some signs of weakness. The ISM Manufacturing Index came in at 49.1, slightly below expansion but still improving, while ISM Services fell to 50.0, signaling flat growth. Comments in both surveys noted that tariff uncertainty is weighing on orders, though underlying demand remains stable. Due to the shutdown, the official Employment Report was withheld but the private report, ADP Payrolls, came in negative once again and well below expectations.

Interest rates were mixed on the week. Long-term yields declined slightly, while mortgage rates rose again. According to the CME FedWatch Tool, markets are pricing a 95% chance of another 25 bp rate cut at the Fed’s October 29 meeting, up from 88% last week. Odds of two additional cuts by year-end have climbed to 85%. The Atlanta Fed’s GDPNow model shows Q3 growth tracking at 3.8%, just below last week’s 3.9%.


This Week

With the shutdown extending into its second week, economic data releases are expected to remain limited. The U.S. Trade Deficit report is unlikely to be published as scheduled. Fed commentary will take center stage, including remarks from new Governor Stephen Miran, who dissented at the last meeting in favor of a deeper 50 bp cut. Markets will be watching for any signs of a policy shift heading into the final quarter of the year.

We hope you have a great week. If there’s anything we can do to help you, please feel free to reach out to ben.vaske@orion.com or opsresearch@orion.com.
 

Get Your Own Market Commentary

Client-Friendly Weekly Wire

Want a version of Weekly Wire you can send directly to your clients? Subscribe to our Weekly Wire newsletter and get a client-friendly version every Monday. Simply download, add your firm's logo, and use with your clients!


Key Data

Stocks, Bonds, Alternatives, and Real Assets as of October 3, 2025

Security Name

Risk Score

1 Wk

1 Mo

QTD

YTD

1 Yr

3 Yr Ann.

Global Equities (60% US, 40% Intl)

100

1.79%

4.76%

0.92%

20.50%

20.04%

22.86%

S&P 500 Total Return

102

1.11%

4.26%

0.43%

15.32%

19.38%

24.05%

Dow Jones Industrial Average

97

1.11%

3.39%

0.78%

11.34%

13.21%

18.90%

NASDAQ 100 Total Return

122

1.17%

5.94%

0.44%

18.63%

26.14%

31.27%

TV Benchmark

107

1.13%

4.53%

0.55%

15.10%

19.58%

24.74%

Morningstar US Large Cap

102

1.02%

4.70%

0.37%

16.70%

21.84%

26.32%

Morningstar US Mid Cap

113

1.10%

2.43%

0.56%

10.75%

12.65%

16.44%

Morningstar US Small Cap

125

1.49%

3.26%

1.32%

10.23%

12.34%

15.68%

Morningstar US Value

98

1.10%

3.23%

0.79%

13.45%

11.86%

17.25%

Morningstar US Growth

126

1.15%

4.54%

0.27%

16.17%

25.29%

24.72%

MSCI ACWI Ex USA

98

3.00%

6.01%

1.71%

28.80%

20.58%

21.67%

MSCI EAFE

101

2.73%

4.90%

1.59%

27.72%

19.76%

22.60%

MSCI EM

98

3.68%

8.66%

2.08%

30.88%

20.39%

19.61%

Bloomberg US Agg Bond Index

27

0.46%

1.23%

0.24%

6.39%

3.43%

4.71%

Bloomberg High Yield Corp Bond Index

41

0.23%

1.03%

0.11%

7.34%

7.63%

10.93%

Bloomberg Commodity Index

70

0.31%

2.20%

0.73%

10.17%

7.53%

2.61%

Wilshire Liquid Alternative Index

25

0.24%

1.46%

0.14%

5.83%

4.37%

5.91%

US Dollar

10

-0.72%

-0.56%

0.07%

-9.81%

-3.77%

-4.44%

Bloomberg US Treasury Bill 1-3mo

1

0.07%

0.37%

0.05%

3.30%

4.49%

4.88%

Source: Morningstar

The TV Benchmark represents an average of the S&P 500, Dow Jones IA, and NASDAQ 100 return indexes. The Orion Risk Score represents risk relative to the global equity market.


Interest Rates as of October 3, 2025

Rate

This Week

1 Wk Δ%

13-Wk Treasury Yield

3.86%

0.00%

10-Yr Treasury Yield

4.12%

-0.07%

Bloomberg US Agg Yield

4.36%

-0.06%

Avg Money Mkt Yield

3.95%

0.00%

Avg 30-Yr Mortgage Rate

6.34%

0.07%

Sources: Yahoo Finance, S&P Global, Crane Data, BankRate


Key Economic Data Last Week

Data Point

Expectation

Actual

Job Openings

7.1M

7.2M

Consumer Confidence

96.0

94.2

ADP Employment

45,000

-32,000

ISM Manufacturing

48.9%

49.1%

U.S. Employment Report

45,000

--

U.S. Unemployment Rate

4.3%

--

ISM Services

52.0%

50.0%

Source: MarketWatch


Key Economic Data This Week

Data Point

Expectation

Release Date

U.S. Trade Deficit

-60.7M

10/7/25

Consumer Credit

$14.0B

10/7/25

Wholesale Inventories

--

10/9/25

Source: MarketWatch

 
More Just for You

Want Resources for Your Clients?

Get a version of Weekly Wire you can send directly to your clients. Subscribe to our Weekly Wire newsletter and get a client-friendly version every Monday. Simply download, add your firm's logo, and use with your clients!

The views expressed herein are exclusively those of Orion Portfolio Solutions, LLC d/b/a Brinker Capital Investments, a registered Investment Advisor, and are not meant as investment advice and are subject to change. Information contained herein is derived from sources we believe to be reliable, however, we do not represent that this information is complete or accurate and it should not be relied upon as such. This information is prepared for general information only. It does not have regard to the specific investment objectives, financial situation, and the particular needs of any specific person.

An index is an unmanaged group of assets considered to be representative of a select segment or segments of the market in general, as determined by the index manager for the purposes of managing a specific index. You cannot invest directly in an index.

The CFA® is a globally respected, graduate-level investment credential established in 1962 and awarded by CFA Institute — the largest global association of investment professionals. To learn more about the CFA charter, visit www.cfainstitute.org.

Think2perform’s Behavioral Financial Advice program integrates traditional finance practices with psychology and neuroscience to improve emotional competency and decision-making behavior that increases effective usage of the financial plan with clients. To obtain the Behavioral Financial Advisor (BFA) designation, participants must complete a self-directed course, which takes 20-30 hours to complete, and includes a mix of interactive exercises, videos and case studies. To learn more about the BFA, visit https://www.think2perform.com.

Wealth management services provided by Orion Portfolio Solutions, LLC (“OPS”), a registered investment advisor. Orion OCIO services provided by TownSquare Capital, LLC (“TSC”), a registered investment advisors. OPS and TSC are affiliates and wholly owned subsidiaries of Orion Advisor Solutions, Inc.