Weekly Notes from Tim

By Tim Holland, CFA, Chief Investment Officer

  • Several macro topics have been of great interest to Wall Street this year: the conflicts in Eastern Europe and the Middle East; global trade; US debt and the outlook for the US dollar, which has fallen 10% year to date, it’s worst start to a year since 1973, and the subject of this week’s note.    
     
  • Accurately forecasting foreign exchange markets is a very difficult undertaking. As it concerns what drives the value of a nation’s currency, many economists would likely point to, among other factors, interest rates (higher rates should be bullish for a currency; lower rates bearish); economic growth (a strong economy should be bullish for a currency; a weak economy bearish) and government finances (a budget surplus should be bullish for a currency; a budget deficit – which necessitates more borrowing – bearish). What we find interesting is that interest rates and bond yields are higher here at home than in most developed countries and the US economy is performing as well as if not better than most major economies around the world, yet the US dollar has still tumbled in 2025. In looking for catalysts for that sell-off, many on Wall Street have pointed to the likely persistency of significant US fiscal deficits and ever-increasing US debt, and uncertainty around US trade and defense policy.  
     
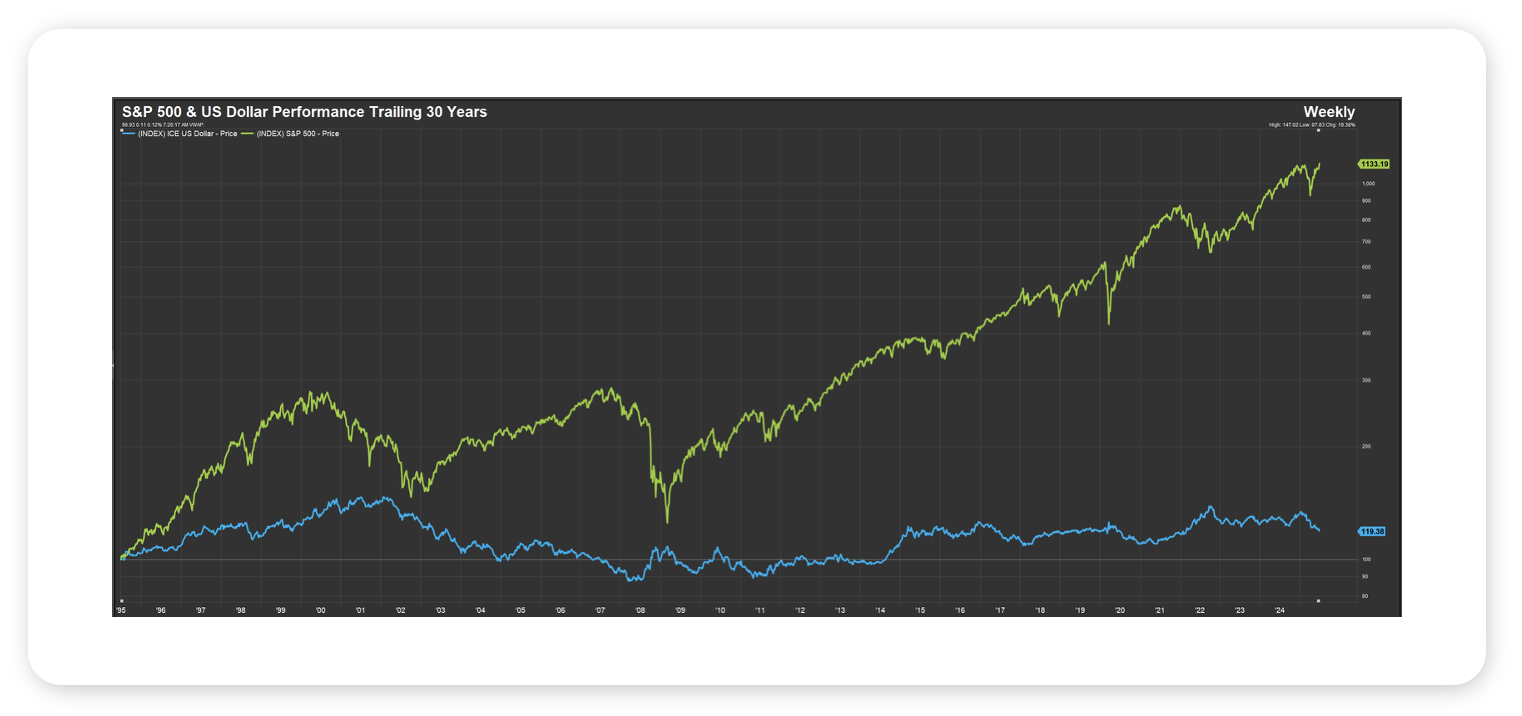
  • Regardless of the cause of dollar weakness, and which way the greenback is headed from here, we think it is worth pointing out that US equities – over the long-term – have managed to move higher when the US dollar was gaining ground, losing ground or moving sideways. To put a finer point on that point, consider that over the past 30 years, US equites, as measured by the S&P 500, have gained about 1100% while the US dollar, as measured by the ICE US Dollar Index, has gained about 20%, while enduring meaningful rallies and corrections (see chart).  
     
  • At the risk of being too confident, we are confident US equities can continue to do well regardless of which way the US dollar is headed, with their fate ultimately driven by corporate profits and interest rates.  
     
Chart 1

Data Source: FactSet, 7/2/2025


Looking Back, Looking Ahead

By Ben Vaske, BFA, Senior Investment Strategist

Last Week

Despite the short trading week in observance of the 4th of July, US equities continued their gains to reach new all-time highs. The S&P 500 gained over 2%, while the tech-heavy NASDAQ 100 gained just under 1%. US small caps caught a stronger bid and gained over 3% on the week. While small caps have their share of headwinds – notably higher rates – they are only lagging the S&P 500 by just less than 2% over the last 12 months. International gains were more modest without the currency effect of a declining dollar on the week (DXY was about flat) but are still outperforming US equities by double digits. The ADP employment report came in much weaker than expected early in the week, raising suspicions that we would see more exaggerated cracks in Nonfarm Payrolls, but that report beat expectations on Thursday – the US unemployment rate fell to 4.1%. Off that stronger-than-expected report, treasury yields rallied higher as expectations for rate cuts from the Fed fell. Expectations of a cut at the July meeting fell from 23% to 6% on Thursday, according to the CME FedWatch Tool. Also notable out of Washington was the signing of President Donald Trump’s sweeping legislation, “The One Big Beautiful Bill” on Friday.  
 

This Week

On Sunday, the US administration confirmed that the 90 day reciprocal tariff pause that was set to expire this week (July 9th) was pushed August 1st to allow a few more weeks for trade deal negotiations – any country that has yet to make a deal with the US by then will have their Liberation Day tariffs reinstated. We will also be watching for any market reaction to the signing of the Big Beautiful Bill, as the legislation was signed while markets were closed on Friday – though our expectation is that any market effects would have been priced in. Q2 earnings will begin later this week, with the only notable release coming from Delta Air Lines. The economic calendar is otherwise light, with small business optimism (NFIB) and Consumer Credit being released.  


We hope you have a great week. If there’s anything we can do to help you, please feel free to reach out to ben.vaske@orion.com or opsresearch@orion.com.
 

Get Your Own Market Commentary

Client-Friendly Weekly Wire

Want a version of Weekly Wire you can send directly to your clients? Subscribe to our Weekly Wire newsletter and get a client-friendly version every Monday. Simply download, add your firm's logo, and use with your clients!


Key Data

Stocks, Bonds, Alternatives, and Real Assets as of July 4, 2025

Security Name

Risk Score

1 Wk

1 Mo

QTD

YTD

1 Yr

3 Yr Ann.

Global Equities (60% US, 40% Intl)

100

1.33%

4.38%

1.01%

12.06%

16.09%

17.75%

S&P 500 Total Return

102

2.29%

5.31%

1.22%

7.50%

14.95%

19.77%

Dow Jones Industrial Average

97

3.36%

5.59%

1.70%

6.33%

16.11%

15.24%

NASDAQ 100 Total Return

122

1.89%

5.65%

0.85%

9.26%

14.16%

26.49%

TV Benchmark

107

2.51%

5.52%

1.26%

7.70%

15.07%

20.50%

Morningstar US Large Cap

102

2.16%

5.55%

1.03%

7.77%

14.93%

21.57%

Morningstar US Mid Cap

113

2.83%

4.37%

1.76%

7.06%

17.61%

14.19%

Morningstar US Small Cap

125

2.95%

6.02%

2.81%

3.58%

13.15%

12.44%

Morningstar US Value

98

2.78%

4.91%

2.02%

7.97%

15.29%

13.31%

Morningstar US Growth

126

1.50%

5.78%

0.50%

8.95%

20.00%

21.04%

MSCI ACWI Ex USA

98

0.30%

2.62%

0.34%

18.72%

16.24%

14.71%

MSCI EAFE

101

0.06%

1.17%

0.01%

19.94%

15.67%

16.48%

MSCI EM

98

0.45%

5.63%

0.88%

16.59%

14.83%

10.79%

Bloomberg US Agg Bond Index

27

-0.31%

1.38%

-0.44%

3.56%

5.33%

2.19%

Bloomberg High Yield Corp Bond Index

41

0.53%

1.90%

0.21%

4.78%

10.48%

9.94%

Bloomberg Commodity Index

70

0.91%

1.46%

1.38%

6.98%

5.90%

0.56%

Wilshire Liquid Alternative Index

25

0.47%

1.43%

0.26%

2.85%

3.27%

4.36%

US Dollar

10

0.03%

-2.06%

0.31%

-10.42%

-7.80%

-2.59%

Bloomberg US Treasury Bill 1-3mo

1

0.11%

0.39%

0.07%

2.20%

4.76%

4.68%

Source: Morningstar

The TV Benchmark represents an average of the S&P 500, Dow Jones IA, and NASDAQ 100 return indexes. The Orion Risk Score represents risk relative to the global equity market.


Interest Rates as of July 4, 2025

Rate

This Week

1 Wk Δ%

13-Wk Treasury Yield

4.24%

0.04%

10-Yr Treasury Yield

4.35%

0.06%

Bloomberg US Agg Yield

4.66%

0.05%

Avg Money Mkt Yield

4.14%

0.04%

Avg 30-Yr Mortgage Rate

6.80%

-0.07%

Sources: Yahoo Finance, S&P Global, Crane Data, BankRate


Key Economic Data Last Week

Data Point

Expectation

Actual

ISM Manufacturing PMI

48.6

49.0

ADP Employment

100,000

-33,000

ISM Services PMI

50.5

50.8

U.S. Employment Report

110,000

147,000

U.S. Unemployment Rate

4.3%

4.1%

Source: MarketWatch,  First Trust


Key Economic Data This Week

Data Point

Expectation

Actual

NFIB Optimism Index

98.8

7/8/25

Consumer Credit

$10.0B

7/8/25

Wholesale Inventories

-0.3%

7/9/25

Monthly U.S. Federal Budget

--

7/11/25

Source: MarketWatch

 
More Just for You

Want Resources for Your Clients?

Get a version of Weekly Wire you can send directly to your clients. Subscribe to our Weekly Wire newsletter and get a client-friendly version every Monday. Simply download, add your firm's logo, and use with your clients!

The views expressed herein are exclusively those of Orion Portfolio Solutions, LLC d/b/a Brinker Capital Investments, a registered Investment Advisor, and are not meant as investment advice and are subject to change. Information contained herein is derived from sources we believe to be reliable, however, we do not represent that this information is complete or accurate and it should not be relied upon as such. This information is prepared for general information only. It does not have regard to the specific investment objectives, financial situation, and the particular needs of any specific person.

An index is an unmanaged group of assets considered to be representative of a select segment or segments of the market in general, as determined by the index manager for the purposes of managing a specific index. You cannot invest directly in an index.

The CFA® is a globally respected, graduate-level investment credential established in 1962 and awarded by CFA Institute — the largest global association of investment professionals. To learn more about the CFA charter, visit www.cfainstitute.org.

Think2perform’s Behavioral Financial Advice program integrates traditional finance practices with psychology and neuroscience to improve emotional competency and decision-making behavior that increases effective usage of the financial plan with clients. To obtain the Behavioral Financial Advisor (BFA) designation, participants must complete a self-directed course, which takes 20-30 hours to complete, and includes a mix of interactive exercises, videos and case studies. To learn more about the BFA, visit https://www.think2perform.com.

Wealth Management services offered through Orion Portfolio Solutions, LLC d/b/a Brinker Capital Investments a registered investment advisor.