No Slam Dunks · Invest in the Magnificent Seven? · It May Be Time for Active Management 

Portfolio Advice, Talking Points, and Useful Resources

  • There are no slam dunks in investing. The only certainty is uncertainty. 
  • The Magnificent Seven has been magnificent. Don’t expect that to continue forever. 
  • Active management will shine again. When it does, some of its historical disadvantages will have lessened.


No Slam Dunks

There are no slam dunks in the markets, at least in terms of economic calls. Remember last year’s sure-fire call of an economic recession? What about the near-certain aggressive interest rate cutting the Federal Reserve was supposed to do this year? 

When it comes to investing, the only certainty is uncertainty. To prepare, investors need to consider what is probable in the markets, but also consider what is possible. 

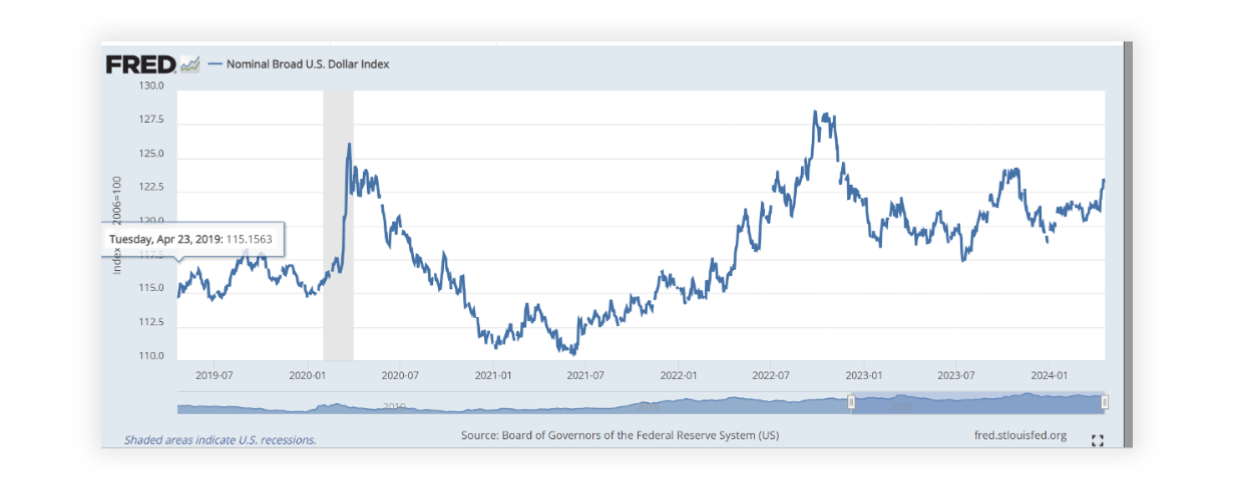
What might be considered some slam dunk views in the market now? One is that the U.S. dollar will continue to get stronger relative to international currencies, and in turn U.S. markets will outperform on the back of this currency strength. This expectation is built on the changing view that the Federal Reserve will not cut rates as aggressively as many had expected, partly because economic growth has been stronger than expected and partly because inflation hasn’t been vanquished. Primarily because of this changing expectation, the dollar has indeed strengthened in recent months. It regained its losses over the last year and is now marginally higher year-over-year. 

All else being equal, dollar strength suggests U.S. stock market outperformance. However, other factors should be considered. For instance, the U.S. market has much heavier exposure to growth/tech stocks than other non-U.S. stock markets. If growth/tech starts to underperform, and arguably that has been the case since early March, the U.S. stock market may begin to lag. As of this writing, since early March the dollar is up smartly, but the overall U.S. stock market has not outperformed. 

Is it even a slam dunk that the dollar will strengthen in the years ahead? The dollar is considered expensive, but perhaps more importantly, it has had lower price highs over the last five years despite U.S. economic dominance. Could other factors, such as the U.S.’s massive debt and its aggressive war-and-depression-like deficit spending be factored in by the markets? The U.S. has had superior relative economic growth of late, and many investors expect that to continue. But without that extraordinary fiscal spending, is the growth still superior? As Strategas’s chief economist, Don Rissmiller, has pointed out, U.S. growth has been impressive in recent years, partly due to massive fiscal spending and partly due to immigration. Regarding the latter, immigration has helped provide a necessary supply of labor (particularly as U.S. manufacturing has brought factories and jobs back onshore) and in turn increased economic demand. 


April 2024 Monthly Commentary Chart 1


Currently, U.S. growth expectations are quite elevated. Double-digit earnings growth is expected for the next three years. Note however that only twice since the 1980s have U.S. companies managed three consecutive years of earnings growth. It happened in the mid-1990s and in the mid-2000s. Since 2008, actual earnings have come in below beginning of the year expectations every year, except for 2018. 

The recent run of short-term, non-U.S. returns being competitive against U.S. returns could signal a long-awaited turn in relative performance. Even if it does not, the turn will eventually happen, and it could last for years. For example, 15 years ago, non-U.S. markets traded at par with the U.S. market in terms of valuations. Now, the U.S. trades at an 81% premium.
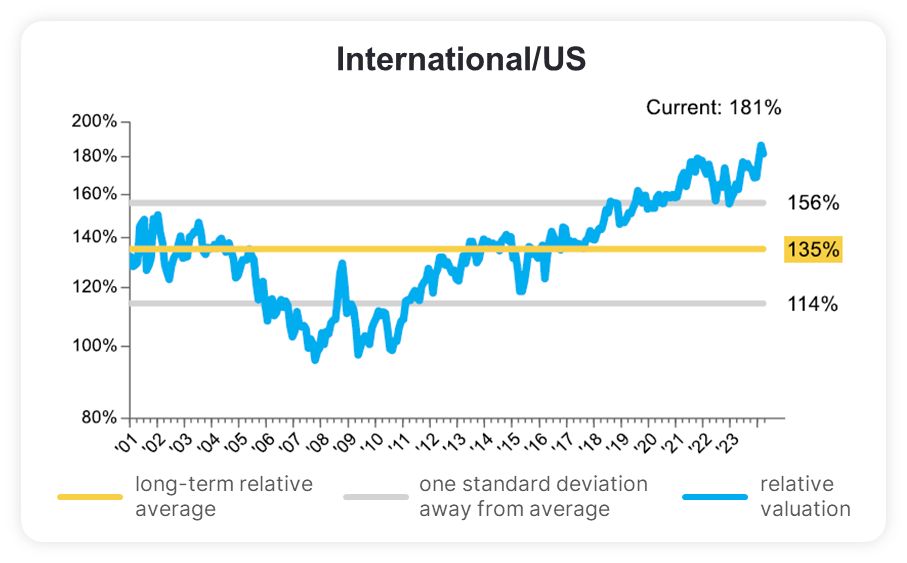
 

International/US | OPS Chart Pack, April 2024
Source: Factset


The chart above illustrates an equal weighting of four valuations: price/earnings, price/sales, price/cash flow and price/book ratios since the beginning of the century. Another way to look at valuations is through CAPE ratios and other cyclically adjusted valuation measures, which show average earnings over the last 10 years. No surprise here, but the U.S. is indeed expensive.

The table below shows CAPE ratios from around the world as of March 31. These numbers can be assessed by formulating a crude expected return calculated via earnings yields (the inverse of the CAPE ratio). In this case, the U.S. has a 3% earnings yield when the median CAPE ratio of stock markets around the world is 6.2%. That suggests the U.S. could underperform by more than 3% per year in the next decade. Some analysts fortify that expected return by reviewing dividend yields. Using the cyclically adjusted dividend yield (CAPD), the U.S. market appears expensive again, with a yield of 1.2% instead of 2.9%. That’s another ~2% of expected underperformance. 
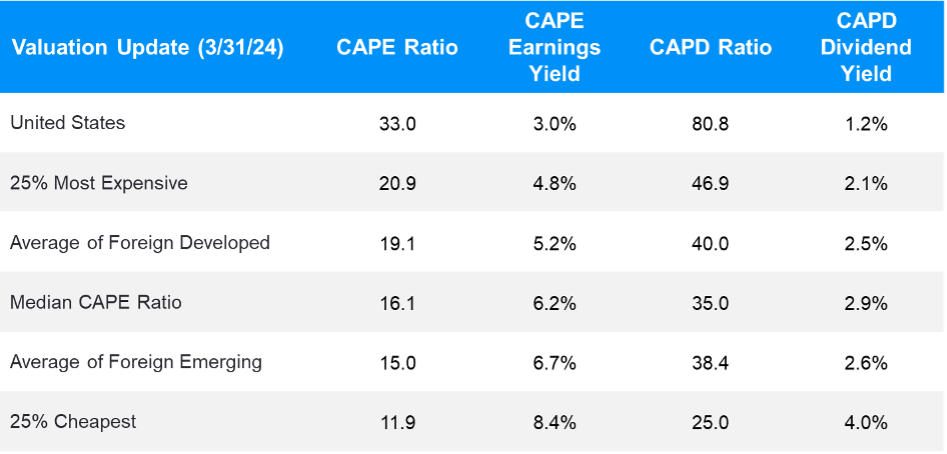
 

Monthly Commentary April 2024: Chart 3
Source: Idea Farm


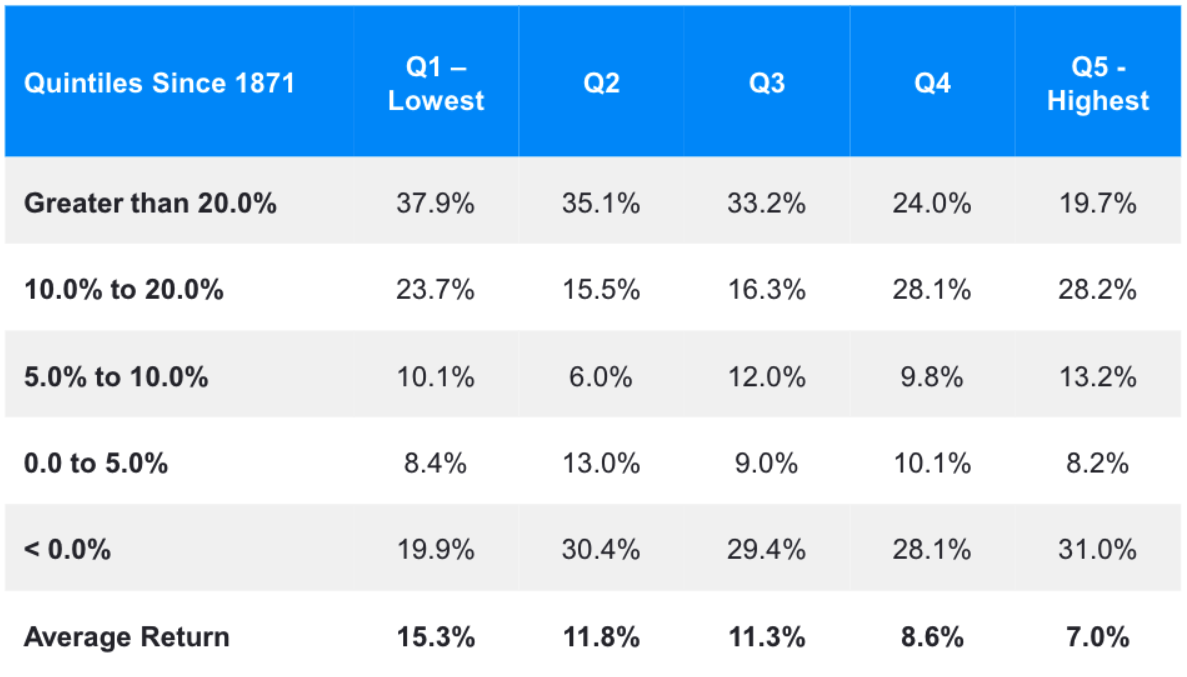
Given that high valuation stocks have outperformed recently, at least in the U.S., it’s popular to say that valuations don’t work in the one-year time frame or that valuation measures simply may not work anymore. The first point isn’t true historically. The table below breaks down valuations into quintiles. The highest quintile, the most expensive stocks, have returned 6.9% per year on average. The lower the valuation, however, moving right to left from high to low, the higher the average return over the following 12 months. The first quintile of the lowest valuations has more than twice the return of the most expensive stocks.


U.S. Market Historical Return Probabilities

Equity Market by Valuation Quintile – P/E

This table uses historical returns since 1871 to show the probabilities of the forward twelve-month return (left column) of the stock market at different valuation levels using P/E Ratios (Q1 being time periods with the lowest P/E; Q5 being periods with the highest). A common misconception is that high market valuations result in negative forward returns. Although Q5 is on average the period of lowest forward returns, it still averages a nominal return of 7.0% with an overall 69.3% probability of positive return.


Rusty Monthly Commentary April 2024 Chart 4
Source: Stock market data is from Yale Professor of Economics Robert Shiller.
Numbers range 1871 – 3/31/2024. The sum of the figures may be lesser or greater than 100% due to rounding. As of 3/31/2024. Past performance is not a guide to future performance. Individual client accounts may vary. 1 Year Forward returns matched with valuation quintiles determined by P/E. Breakpoints of 367.
Q1: P/E is less than 10.85; Q2: 10.85-13.59; Q3: 13.59-16.32; Q4: 16.32-19.08. Q5: 19.08+.


Another potential slam dunk view, which most investors now expect, is strong economic growth. However, with commodity prices, notably gas prices, sharply higher and higher interest rates, is it a slam dunk? We will have a final-term president next year. How will that impact the positive economic tailwinds of fiscal spending and strong immigration? 

Another popular view is that short-term rates are more likely to fall than rise, and mortgage rates will fall with them. When it comes to short-term rates, investors should consider what they’re rooting for. For mortgage rates to fall, an increase in short-term rates is more likely to help. Higher rates typically help reduce inflation. The Fed directly controls only the short end of the yield curve, i.e., the shortest maturities. The market controls the longer end (longer maturities). If the market believes inflation is not under control, but the Fed cuts short-term rates, longer-term rates may rise even further. That surely won’t help mortgage rates. 

There is one slam dunk that remains: diversification. There is a reason it’s considered the only free lunch in investing (though it doesn’t mitigate risk entirely). While it doesn’t necessarily prevent losses during periods of extreme market stress, diversification does with mathematical certitude help reduce overall portfolio volatility.


Get Your Own Market Commentary

Client-Friendly Weekly Wire

Want a version of Weekly Wire you can send directly to your clients? Subscribe to our Weekly Wire newsletter and get a client-friendly version every Monday. Simply download, add your firm's logo, and use with your clients!


How and Why to Diversify Away from the
Magnificent Seven

Nick Codola, CFA, Senior Portfolio Manager

In recent years, including the beginning of this year, the overall return of the Magnificent Seven has been just that: magnificent. Using the S&P 500 weights from early 2024, a portfolio of just the Magnificent Seven would be up handsomely and well above the overall stock market. At approximately a 27% weighting, these stocks have contributed about half of the returns experienced by the S&P this year.

Staying invested in them while looking elsewhere for opportunities is a prudent approach to investing. To do otherwise is to leave portfolio returns up to fate. As Seneca penned in Thyestes, “Who would reject the flood of fortune’s gifts? Anyone who has experienced how easily they flow back.” To that point, the Magnificent Seven are showing cracks in their ranks. AAPL is down YTD, TSLA is in a bear market, and NVDA is well off its price highs. 

More broadly, the top names in the S&P 500 change decade over decade. For example, 10 years ago the top five names in the S&P were Apple, Exxon, Microsoft, Johnson & Johnson, and GE. Ten years before that it was Microsoft, Exxon, GE, Wal-Mart, and Pfizer. To be a large company that constantly innovates and potentially reinvents itself is extremely difficult. The only name that stuck around was Microsoft, underscoring the 80% attrition rate for companies since 2003. 

Sticking with winners and not diversifying could be a recipe for underperformance as those companies start to fall away. To pick on Exxon, since 2002 it has returned nearly 10% annually, and since 2015, it has returned just more than 8% annually. Those appear to be pretty solid returns before noting that the S&P returned nearly 11% and 13% annually, respectively, over those same periods. Even rebalancing into the S&P from the Magnificent Seven could help investors catch the new wave of rising stars while maintaining a position with the original winners.

Exploring other asset classes could also unlock additional portfolio benefits. Diversifying away from the Magnificent Seven does not necessarily mean sacrificing returns, but we believe it may increase the opportunity set to outperform. For example, in the U.S. the energy sector is outperforming both the S&P and the Magnificent Seven so far this year. Metals such as gold and silver are also performing well, and in the commodity space cocoa has nearly tripled this year. 

At Orion, we conducted an internal study on various market cycles and asset classes that outperform in specific scenarios, which we internally refer to as “All Seasons Investing.” We found in environments where rates paused and started to fall, real assets and real estate outperformed. Given the performance of silver and gold, that is being brought to bear. Real estate, especially parts of commercial real estate, has struggled. But every time the yield curve falls, real estate tends to be the top-performing sector of the market. We also found that in rising inflationary environments with above-average interest rates, international equities have outperformed (according to Internal research since 2000 using Morningstar and CPI data). 

Goldman Sachs noted a double handful of stocks that have rivaled the Magnificent Seven over the last three years with smaller drawdowns and less volatility. Goldman dubbed the group “GRANOLAS” (Novo Nordisk, Nestle, ASML, LVMH Moet, AstraZeneca, Roche, Novartis, SAP, L’Oreal, Sanofi, and GSK). The GRANOLAS portfolio has a correlation of 0.8 to the S&P 500, so it not only provides returns but also enhances diversification, lowering volatility in the portfolio alongside the Magnificent Seven. 

Gold and silver both have correlations under 0.3 to the S&P and have also enhanced returns and dampened volatility. Cocoa might be hard to access for the average retail client, but some ETFs target it, and its correlation to the S&P is also under 0.3. Even real estate is starting to show signs of life. Blackstone recently announced it is finding opportunities within the space. 


Active Management: Time to Shine?

The hottest areas for growth in the industry are ETFs and direct indexing, while active management remains cool. Actively managed ETFs are a fast-growing area, but the loss of assets in actively managed mutual funds swamps the gains in actively managed ETFs. However, if the Magnificent Seven begins a period of sustained relative underperformance, it would not be unreasonable to see actively managed investment strategies — those not trying to match and mirror a benchmark but striving to be different and outperform one — start gaining interest and assets again. 

Active management relative performance has had a tough go for some time now. The last period of sustained outperformance was back in the 2000s. Could we soon enter a period like the one following the dot-com era when actively managed, globally diversified, multi-asset portfolios excel again, especially if the definition of active encompasses anything but a pure S&P 500 exposure? Given some of the data above, it seems the global markets are positioned for such a turn. 

It’s important for actively managed strategies to be disciplined and deliver on the promise of being dynamic and active. One factor that will help active strategies, especially against the cap-weighted TV benchmarks such as the S&P 500, is if smaller companies start to outperform. Since 2000, small caps have traded at a 20% discount to the overall market. Now that discount is about 50%.

Diversification away from large-cap U.S. growth stocks could also be key. Other non-benchmark portfolio tilts could include non-U.S. stocks. As mentioned above, non-U.S. stocks are running at significant discounts to the U.S. market. Real assets could also be critical, especially if inflation remains higher and/or more volatile than it has in recent decades. Given the current economic environment, with higher economic growth and inflation data, that seems a decent bet. Investors don’t have much exposure to real assets now. Alternatives, which historically have helped risk-adjusted performance during times of economic and market volatility, are another option. 

In general, active management has lessened some of its long-term disadvantages versus passive. For example, management fees are lower and average cash balances have fallen — cash drag can be impactful when comparing active to passive. Internal transaction costs are also significantly down for active management. Each of these disadvantages has been whittled down. When active starts to outperform again, these structural headwinds won’t be as strong as they were in past decades.

We believe the time will come again for active management. This year's market environment has been more favorable for active management. Is this finally the turn? Either way, for active management strategies to shine, they must remain differentiated and disciplined.


Thank You for Letting Us Serve You

Thank you for your time and trust. If you have any questions or feedback, please let us know. As always:


Stay invested, stay diversified, and stay disciplined.


Invest well and be well,

Rusty Vanneman, CFA, CMT, BFA
Chief Investment Officer – Wealth Management


More Market Commentary

Want More Resources?

Unlock a wealth of market commentary resources from Rusty Vanneman, Orion CIO – Wealth Management, and his team.

Orion Portfolio Solutions, LLC, an Orion Company, is a registered investment advisor.
CAPE Ratio: The cyclically adjusted price-to-earnings ratio, commonly known as CAPE, Shiller P/E, or P/E 10 ratio, is a valuation measure usually applied to the US S&P 500 equity market. It is defined as price divided by the average of ten years of earnings (moving average), adjusted for inflation.
CAPD Ratio: Similar to the CAPE Ratio, but used dividends, rather than earnings, as the primary input.
The CFA® is a globally respected, graduate-level investment credential established in 1962 and awarded by CFA Institute — the largest global association of investment professionals. To learn more about the CFA charter, visit www.cfainstitute.org.
The CMT Program demonstrates mastery of a core body of knowledge of investment risk in portfolio management. The Chartered Market Technician® (CMT) designation marks the highest education within the discipline and is the preeminent designation for practitioners of technical analysis worldwide. To learn more about the CMT, visit https://cmtassociation.org/.
The views expressed herein are exclusively those of Orion Portfolio Solutions, LLC (OPS), a Registered Investment Advisor, and are not meant as investment advice and are subject to change. No part of this report may be reproduced in any manner without the express written permission of OPS. Information contained herein is derived from sources we believe to be reliable, however, we do not represent that this information is complete or accurate and it should not be relied upon as such. This information is prepared for general information only. It does not have regard to the specific investment objectives, financial situation, and the particular needs of any specific person. You should seek financial advice regarding the appropriateness of investing in any security or investment strategy discussed here and should understand that statements regarding future prospects may not be realized. You should note that security values may fluctuate, and that each security’s price or value may rise or fall.
Accordingly, investors may receive back less than originally invested. Past performance is not a guide to future performance. Investing in any security involves certain systematic risks including, but not limited to, market risk, interest-rate risk, inflation risk, and event risk. These risks are in addition to any unsystematic risks associated with particular investment styles or strategies.
When clicking news media links, you are entering third-party websites. These websites are not affiliated with, sponsored by, or endorsed by Orion Portfolio Solutions. The information contained herein, while not guaranteed as to accuracy or completeness, has been obtained from sources believed to be reliable.
Think2perform’s Behavioral Financial Advice program integrates traditional finance practices with psychology and neuroscience to improve emotional competency and decision-making behavior that increases effective usage of the financial plan with clients. To obtain the Behavioral Financial Advisor (BFA) designation, participants must complete a self-directed course, which takes 20-30 hours to complete, and includes a mix of interactive exercises, videos and case studies. To learn more about the BFA, visit https://www.think2perform.com.


Compliance Code: 1 1 2 9, Orion Portfolio Solutions, May 7, 2024