It is no secret that bonds have had a tough couple of years. They experienced back-to-back negative returns in 2021 and 2022, while exhibiting higher volatility and higher correlations with equity markets. Altogether, it raises the issue of whether they can continue to serve their historic role: a low-volatility ballast within a portfolio that diversifies away from equities. Even heralding 2023 as the "year for bonds," as many did, seems in retrospect premature, if not outright wrong.1


Chart Showing Morningstar Direct Data from 11/22/2023


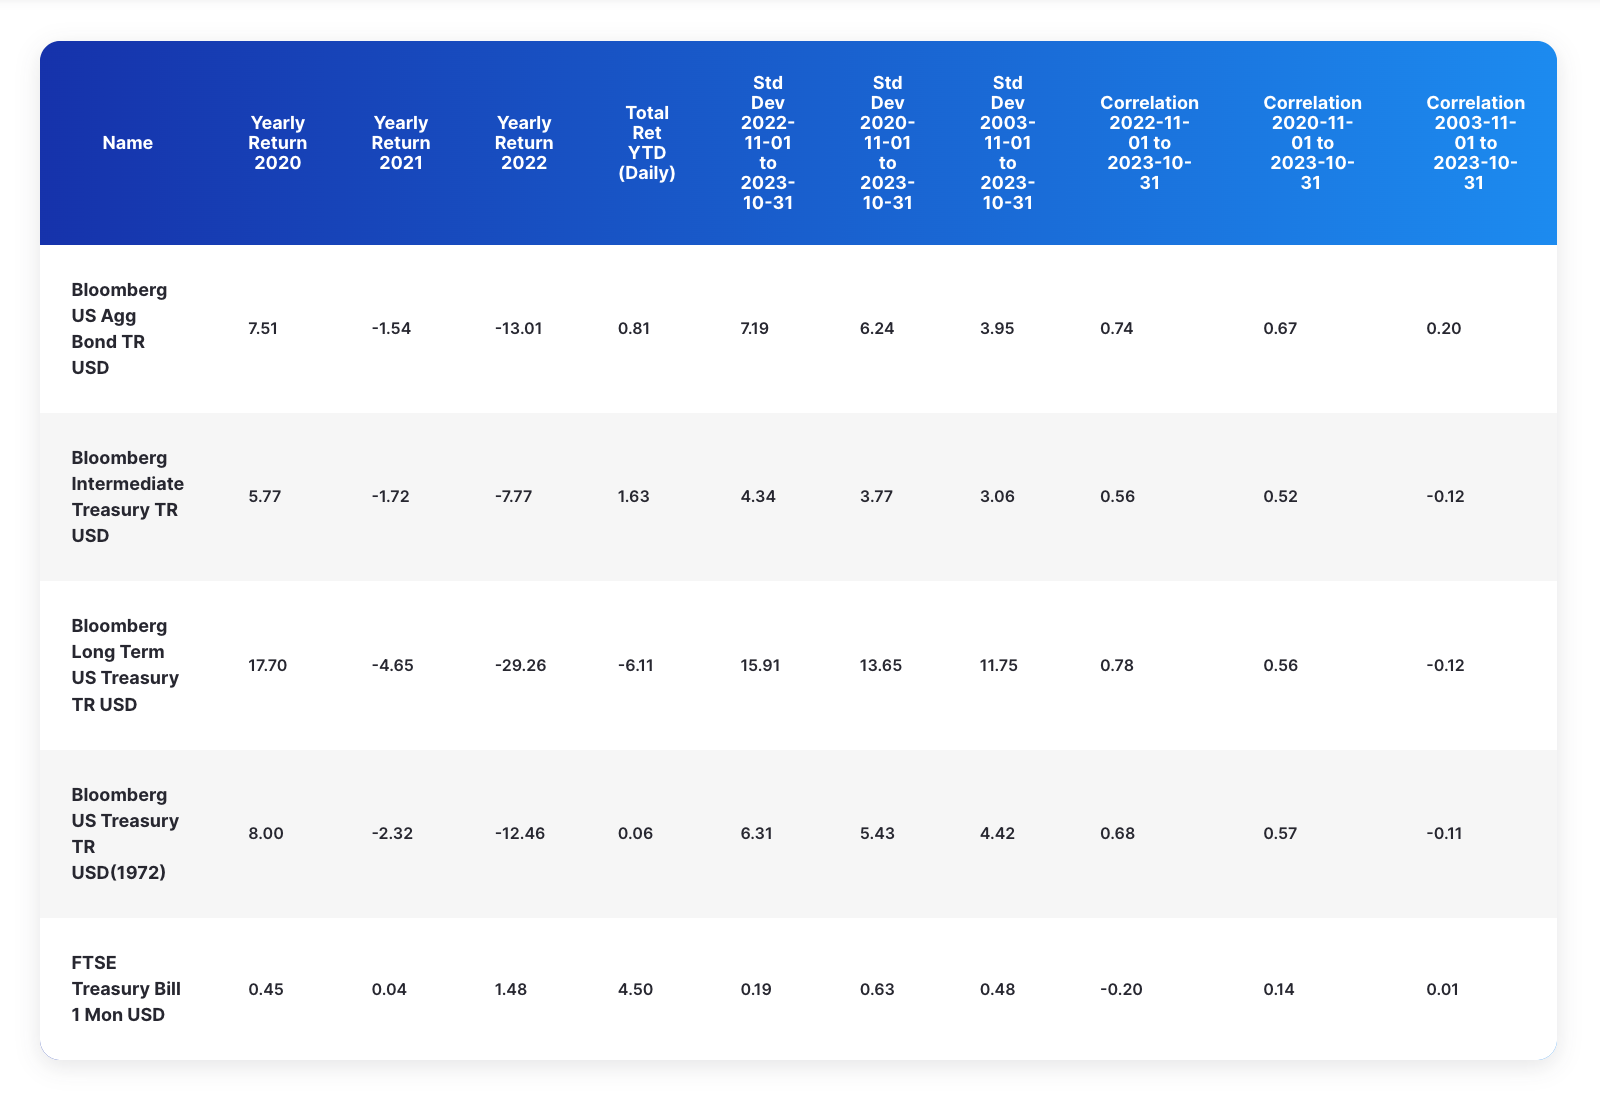
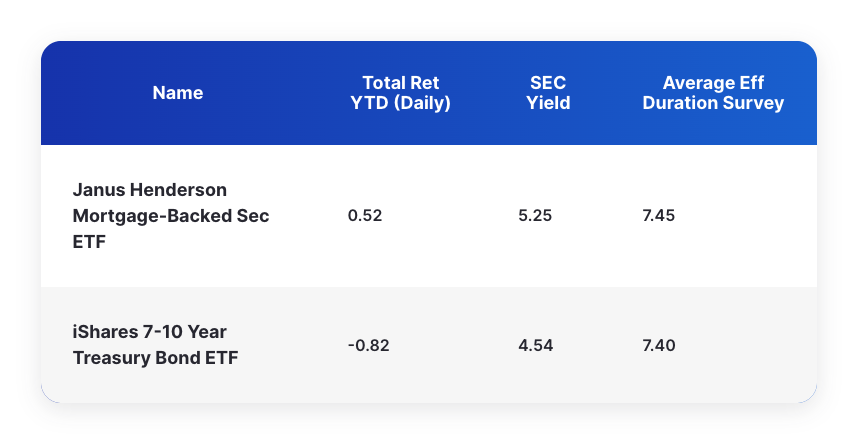
The one standout is ST bonds/cash, represented by the FTSE Treasury Bill 1-3 M TR, eking out positive returns the last few years and up a strong 4.5% year to date. With short-term Treasury yields peaking 5% through the 1-year, it is tempting to dump the whole fixed income allocation into cash, clip the coupon, and have a good day.

To be sure, we at Brinker Capital Investments are not recommending avoiding cash but rather only allocating a portion of the fixed income allocation to cash. Much as adding variation to one’s gym workout aids muscles' growth and strength, adding the following three features to the fixed income portfolio will improve resiliency and returns.

  1. Barbell low duration and high duration assets
  2. Dollar Cost Average (DCA) into longer duration fixed income securities to mitigate timing risk
  3. Diversify the assets invested within the barbell


Like adding new lifts that introduce wider ranges of motion into a workout regimen, implementing a barbell in the portfolio will improve resiliency and flexibility, empowering the portfolio to better respond to different changes in rates. While it is true ST bonds and cash securities do not have much interest rate sensitivity, they do have a much higher reinvestment risk — the risk of not being able to reinvest their cashflows at the security’s rate, because as they mature the investor can only access securities at the prevailing rate. Thus, an allocation to cash transforms interest rate risk into reinvestment risk.

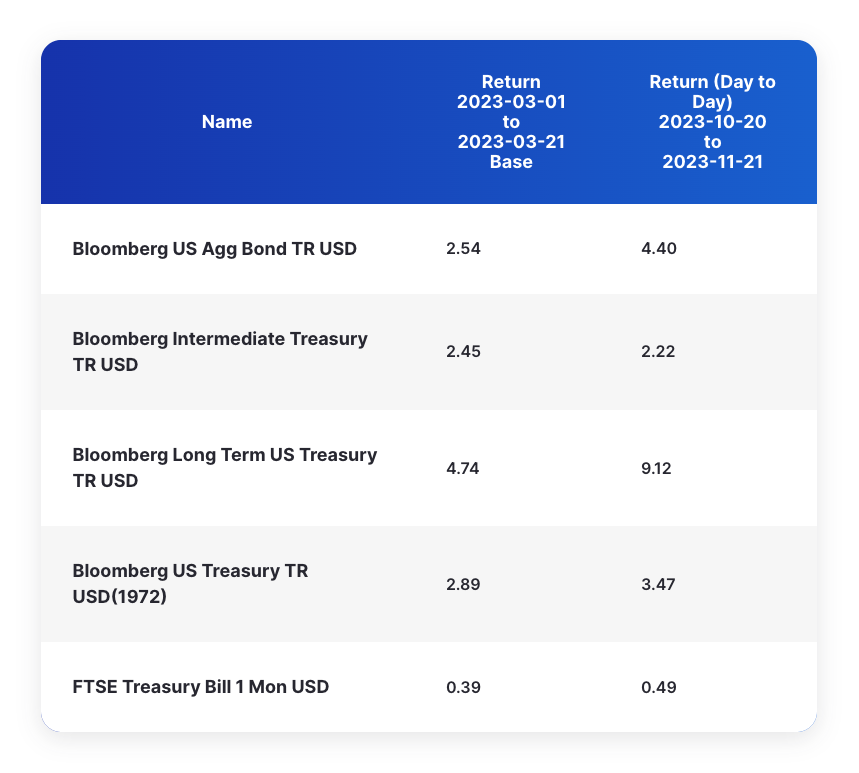
A classic scenario to illustrate this point occurred in 1982. According to government data, the 3-month Treasuries peak auction yield was 10.69%, and the following year it peaked 2% lower at 8.63%. The 10-year Treasury topped out at 13% in ’82 and experienced a similar 2% decline in ’83 to peak at 11.10%. However, reviewing forward returns for the bond market, longer duration asset returns were more robust. The average forward 1-year and 3-year rolling returns for various fixed income assets appear below.2


Chart showing Average 1 Year and 3 Year Forward Return


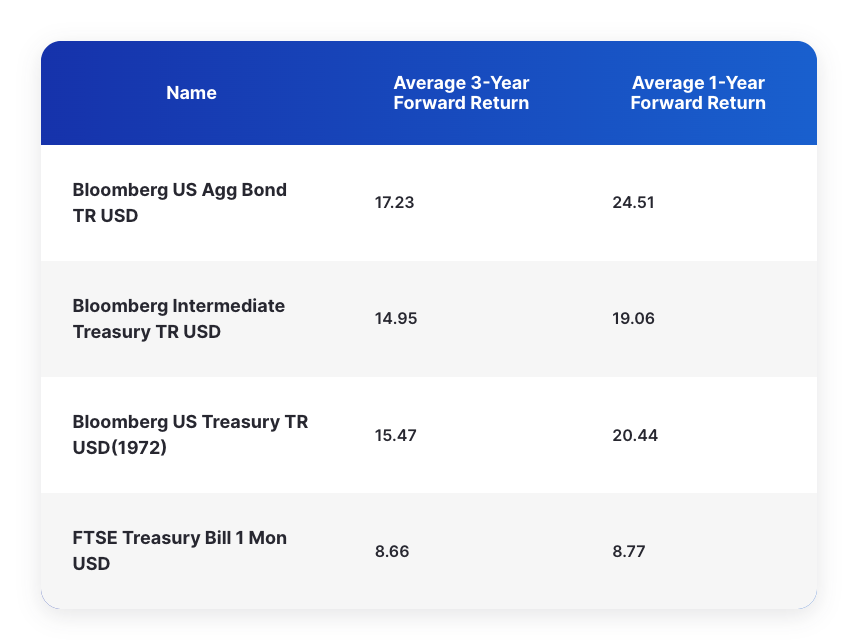
While cash behaved similar to prevailing rates, the forward returns for the longer duration bonds were superior. From this data it could be argued that cash and short-term bonds have a higher sensitivity to interest rates, because in aggregate, the linked returns of those instruments end up matching the prevailing rate, even if each individual security has a low sensitivity to said rates.

Hopefully, the case for why longer duration fixed income assets belong in an allocation is an easy lift, however the more meaningful issue is when. Figuring out the exact time can be difficult as evidenced by anyone who bought the US AGG at the beginning of this year: compared to cash they have underperformed by 3.7% year-to-date!


Trading desk
FREE, On-Demand CE Courses

Learn. Grow.   Achieve.  

Orion Advisor Academy offers advisors free, on-demand practice management and behavioral finance courses designed to streamline meeting your CE requirements and help you achieve more for yourself — and your clients.

Start today.

A solution, well known to the industry, is dollar cost averaging (DCA). Just as when lifting weights, best practice is to ease into the workout by starting with an easier, lower intensity rep and building towards the "max" lift in order to avoid injury — implementing a dollar cost average will incrementally shift the portfolio without causing undue stress. We here at Brinker would recommend implementing a twofold approach: reinvesting cash coupons into longer-duration securities and rebalancing occasionally to maintain a higher percentage of longer-duration assets in the fixed income portfolio.

This will incrementally bring the overall portfolio closer in duration to the US Agg. Some of that decision-making process can be subjective: What is the desired long-term coupon yield? For one individual that rate might be 5% for a 10-year Treasury; for another that number could be 4.5% or 4%.

Regardless of the exact number, DCA-ing will help mitigate pain from downside risk, especially if yields continue rising due to portfolio investments in shorter-duration assets. It will also minimize upside risk by periodically buying (and thus locking in) the prevailing long-term rate, which will be beneficial if yields drop. Two periods — March 2023 and Oct. 20–Nov. 21 of 2023 — are where rates dropped precipitously, and their effects on the longer-duration assets were quite meaningful:3


Chart showing Morningstar Direct Data March and October


Finally, continuing the gym metaphor, changing the grip or form of a specified lift can enhance the "gains" earned. Similarly, changing and diversifying the fixed income security types within the barbell can enhance the profile and returns of the duration buckets.

For example, collateralized loan obligations (CLOs) are an asset class that could beef up the short duration portion of the portfolio. Historically, CLOs have not been available to the broader retail market, but in the last few years, a few firms have launched CLO ETFs, unlocking access to this asset class for retail investors.

CLOs comprise floating-rate loans; thus, they have little to no duration and are packaged together and tranched out. The AAA-rated tranche gets paid out first and experiences any defaults last, while the equity tranche gets paid last and is the first to experience defaults. According to S&P Global, AAA-rated CLOs have not defaulted in over 25 years,4 and their overall default rates are much lower than those of other asset classes.5


Chart showing CLO defaults


Chart showing S&P Annual Global Default Rates


Furthermore, provisions implemented after the GFC have only enhanced their safety. As a side note: post-GFC CLOs are sometimes referred to as "CLO 3.0." This can be an attractive way to diversify the short-duration portion of the barbell, pick up 100+ bps in yield, and keep credit and default risk low.

On the longer-duration side, government agency mortgage-backed securities (agency MBS) can be an attractive asset class that we have nibbled on. An agency MBS is fully guaranteed by the government, so default risk is comparable to a Treasury. Given the unrest in the banking sector in 2023, banks are being very mindful of their duration and have not exhibited the same historic appetite for MBS. This absence of demand from a sector that usually is a big buyer has boosted rates to the higher end of what has been observed over the last decade.6


Chart showing Bloomberg OAS of MBS


Finally, because so many households purchased a home in 2020 and 2021, the average interest rate of those mortgages is quite low — below the current interest rate of cash! This has caused prepayments on mortgages (defined as the combination of either paying off their mortgage early, refinancing their home, or outright selling and buying a new home) to fall to near-historic lows. This trend should persist. Given current mortgage rates are bouncing around 7%–8%, rates would have to fall a few hundred basis points before there would be a meaningful increase in prepayments. Granted, because prepayment is a risk with MBS, adding this to the portfolio would introduce some reinvestment risk.

When investing in MBS, an investor does not need to go too far out in maturity, because most MBS have negative convexity — their duration increases as yields increase, and vice-versa. This means, should rates rise, an allocation can work for the portfolio by also lengthening their duration. It also means as rates rise, all else being equal, a negatively convex security will decline in price more than a security with no convexity. To compensate for that risk, a bond with negative convexity tends to pay a higher coupon versus its vanilla counterpart.

As an added benefit to the ETF investor, buying an MBS ETF with experienced portfolio managers may mitigate some of those risks. For example, JMBS, through judicious allocation to other securitized assets along with security selection within MBS, have currently achieved a portfolio with positive convexity while enjoying higher yields and a similar duration profile as Treasuries. That difference has been the key for some MBS ETFs enjoying positive returns year-to-date, while Treasury ETFs of a similar duration decline.


Chart showing Morningstar Direct Data as of 11/22/23


Chart showing Bloomberg Data 11/24/23


As Ben Franklin penned, “Sloth makes all things difficult, but industry all easy; and he that riseth late must trot all day, and shall scarce overtake his business at night; while laziness travels so slowly, that poverty soon overtakes him.”

While it may be easy to "T-bill and chill," tomorrow’s gains are made today, so don’t get caught napping. When bond yields move, there won’t be an opportunity to catch up. By DCA-ing into longer duration assets as well as improving the asset class mix within the duration barbell, we believe the resulting portfolio will not only be improved but also become more palatable for that average investor.


Fulfill Your CE Requirements for FREE

Free CE. Unlimited Growth.

Enroll in Orion Advisor Academy today to earn CE credit — including our CFP Board-approved Ethics course — and level up your firm and yourself.

1Source: Morningstar Direct, as of 11/22/2023
2Source: Morningstar Direct, Average 1 Year and 3 Year Forward Return Starting January 1982–December 1982.
3Source: Morningstar Direct, as of 11/22/2023
4Source: S&P Financial Services, 2023
5Source: S&P Financial Services, 2023
6Source: Bloomberg OAS of MBS over US Treasuries, 2023
7Source: Morningstar Direct, as of 11/22/2023
8Source: Bloomberg data, as of 11/24/2023


The views expressed herein are exclusively those of Orion Portfolio Solutions, LLC d/b/a Brinker Capital Investments a registered investment advisor, a registered Investment Advisor, and are not meant as investment advice and are subject to change. Information contained herein is derived from sources we believe to be reliable, however, we do not represent that this information is complete or accurate and it should not be relied upon as such. This information is prepared for general information only. It does not have regard to the specific investment objectives, financial situation and the particular needs of any specific person.

Compliance Code: 0 0 5 6, Brinker Capital Investments, January 9, 2024