Valuations Over Votes · Why Diversify with Alternatives and Real Assets · Staying Disciplined Amidst Volatility and Noise
Portfolio Advice, Talking Points, and Useful Resources
- Even though it is election season, the key factors for stock market expectations for long-term investors remain earnings growth and valuations.
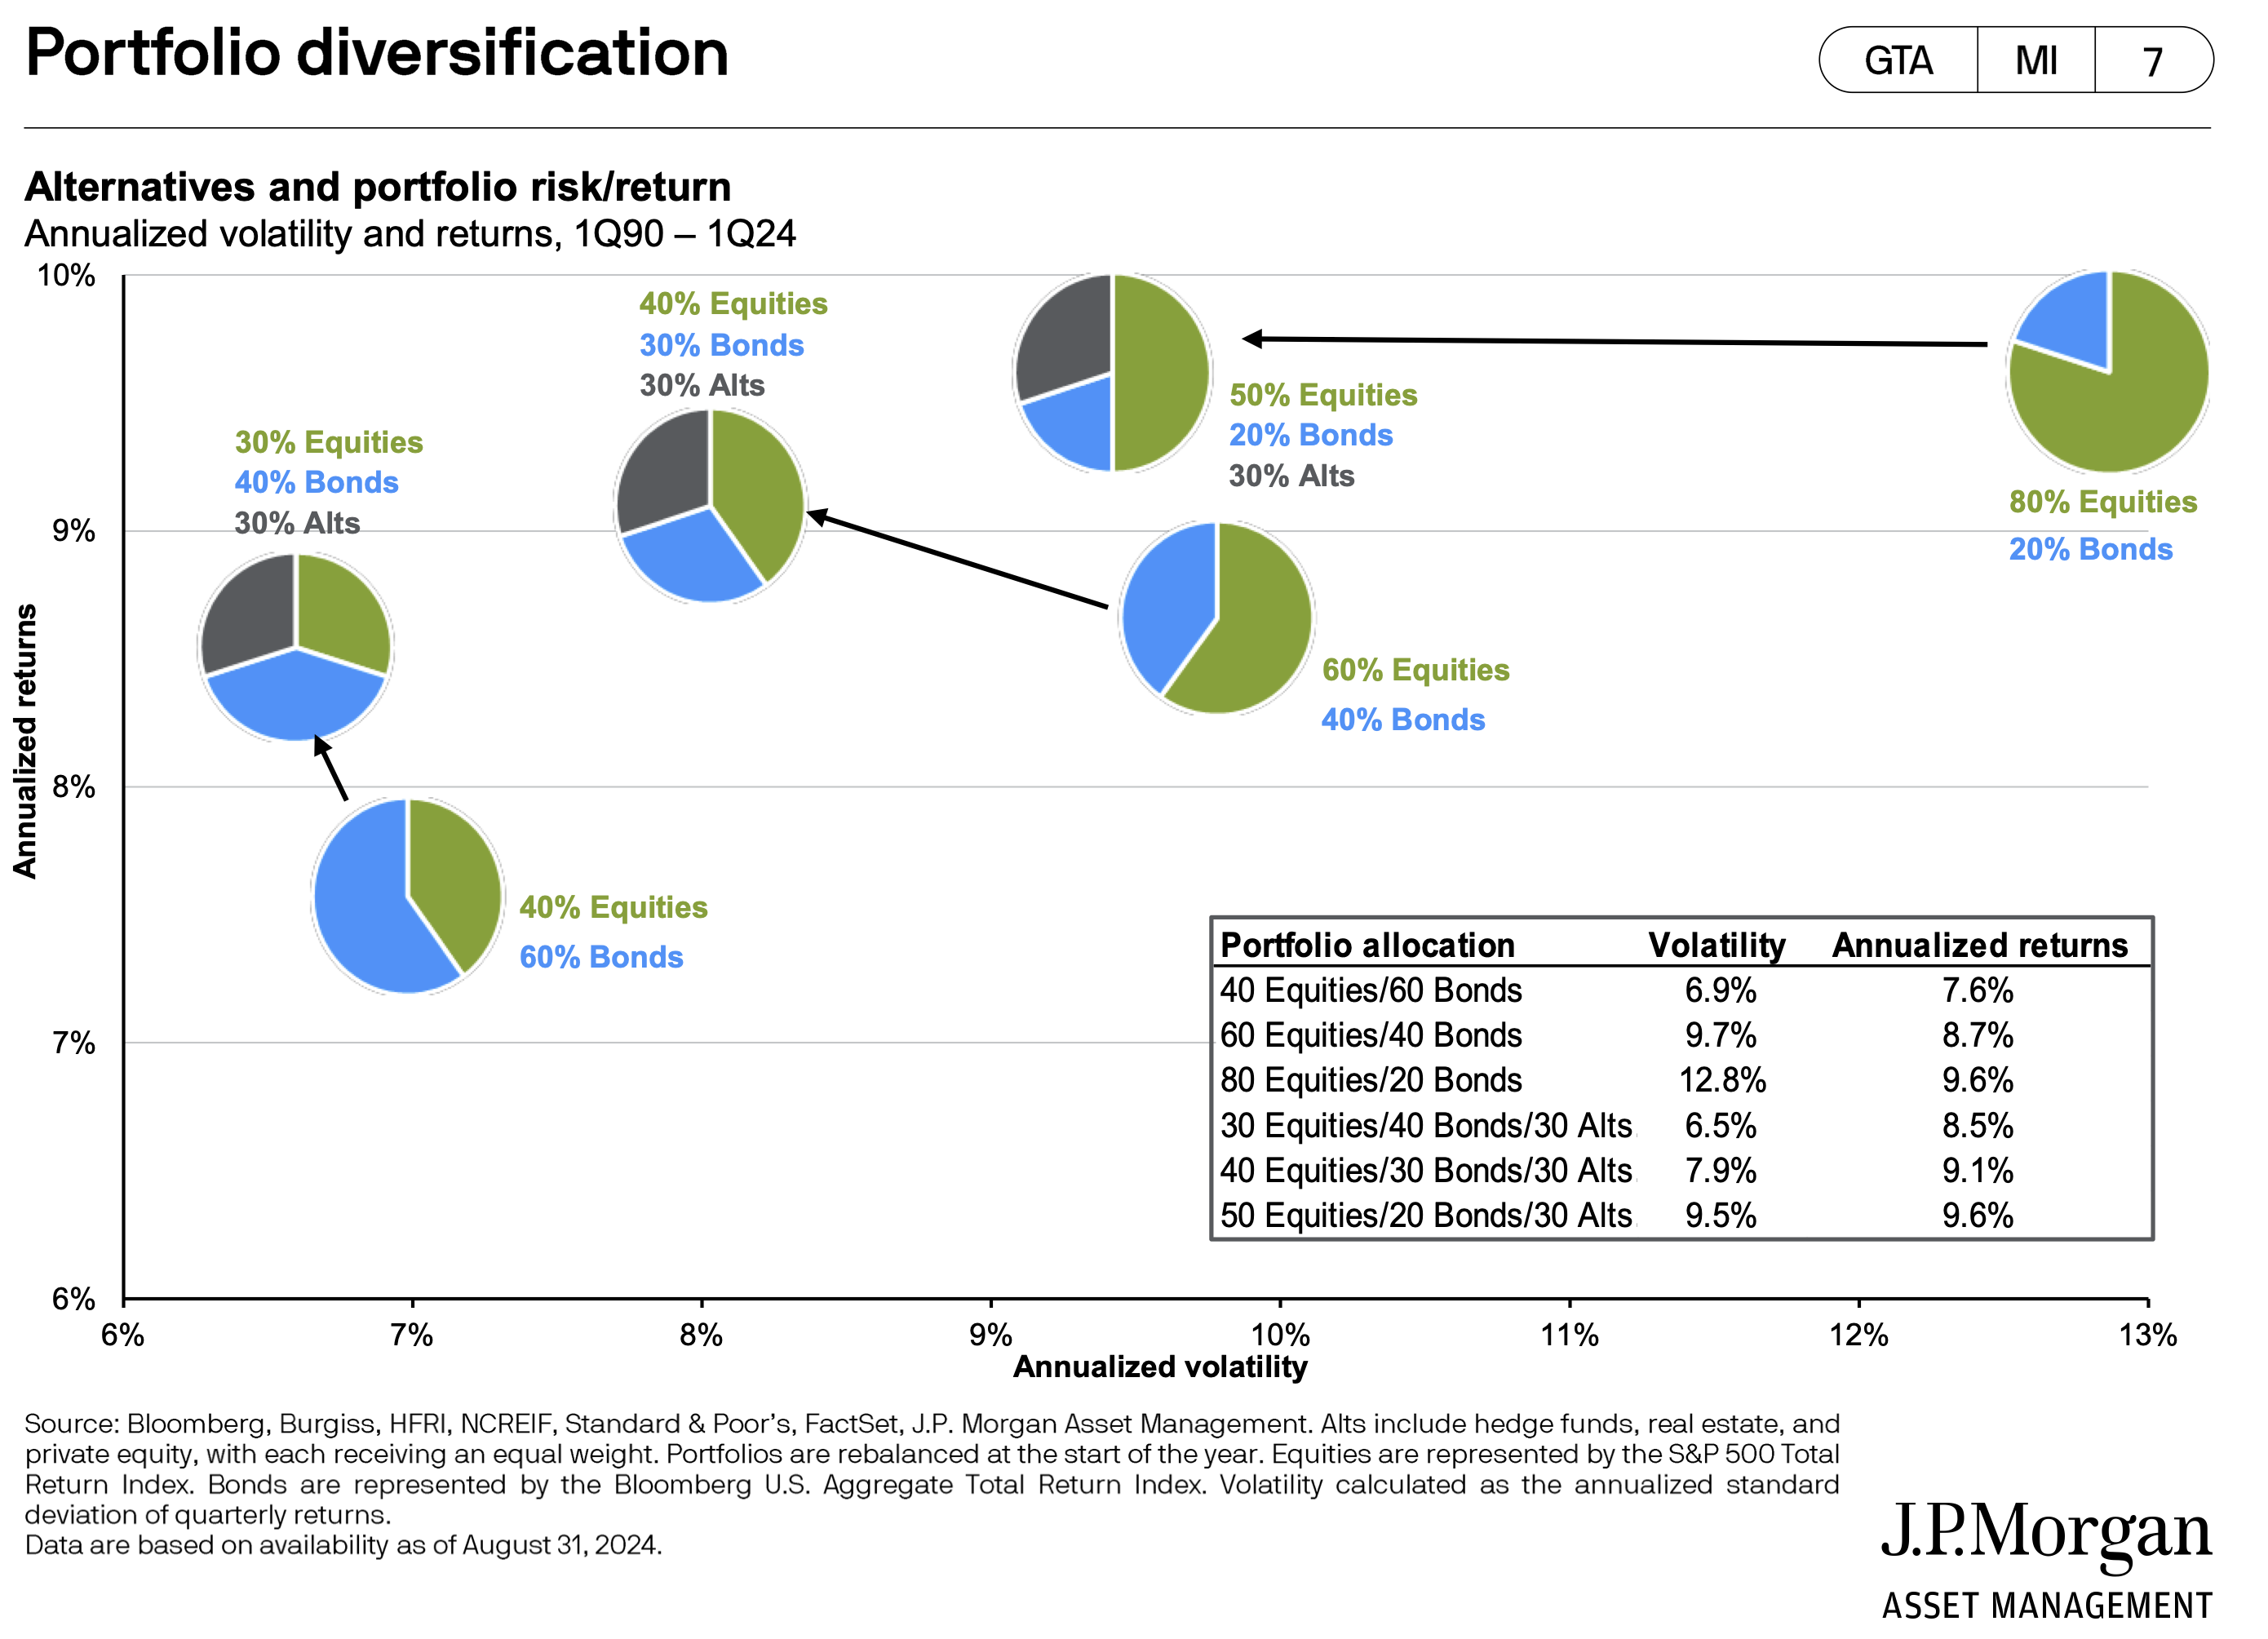
- Diversifying traditional asset allocations with alternatives and real assets can enhance risk-adjusted performance over time.
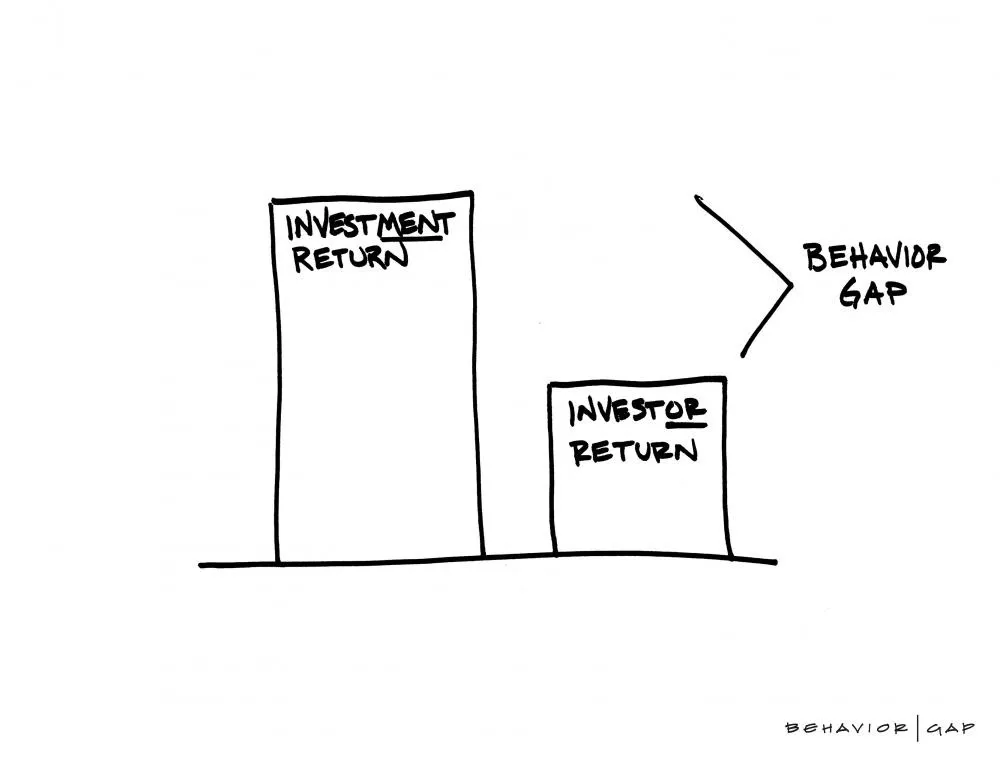
- Financial advisors can add significant value to client portfolios, including staying the course during election season.
As we approach quarter-end, it has been yet another fascinating period for our economy and markets, with no signs of that changing in the weeks ahead. The upcoming election is poised to be historic, and market volatility is likely to persist. In this environment, what should investors do?
In this month’s commentary, we believe that for most investors, the best course of action is to stay on their current path, assuming their portfolio is aligned with their objectives and risk tolerance. As we discuss, the fundamental factors driving stock market expectations remain unchanged—growth and the price one pays for that growth, regardless of who wins the election.
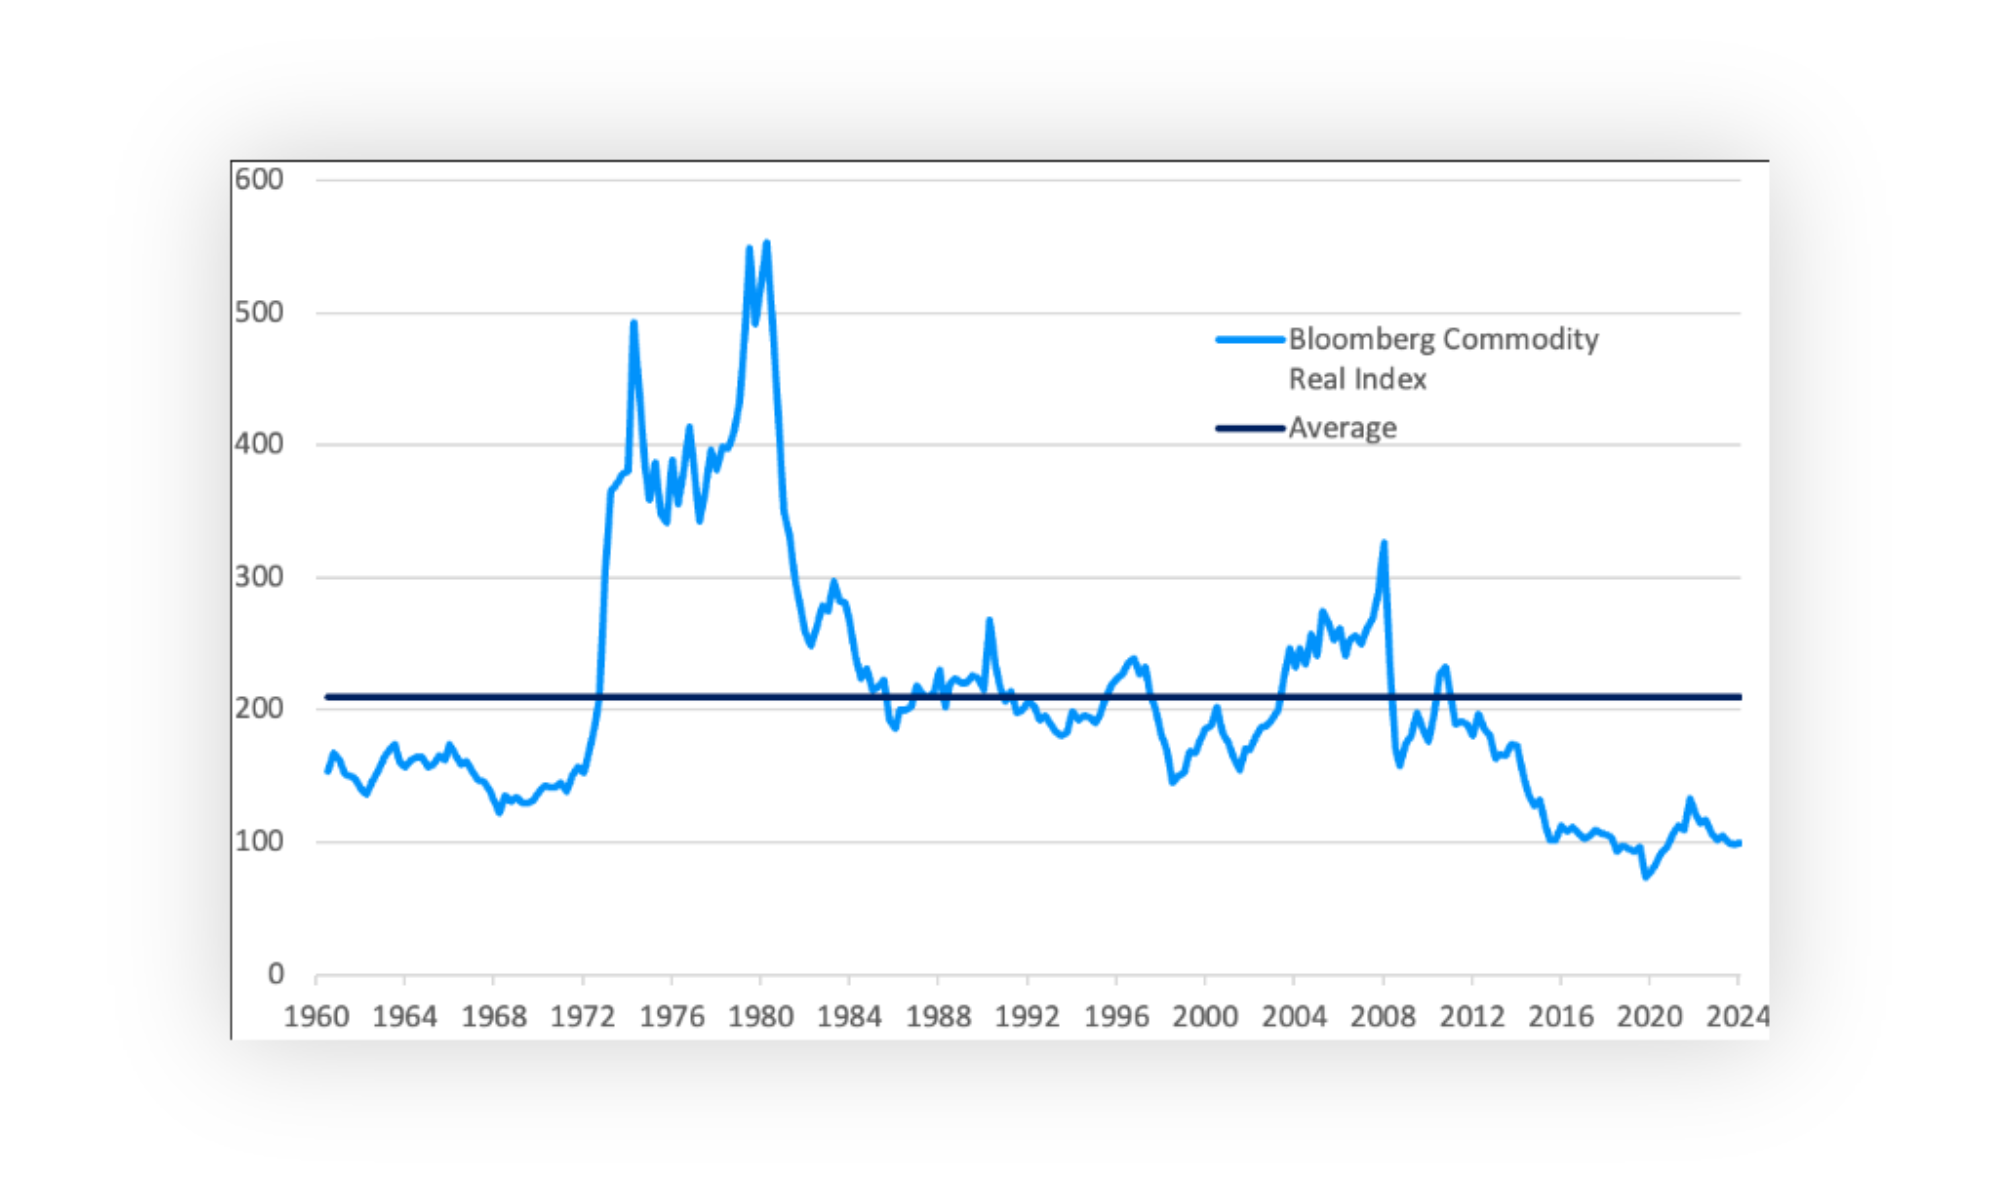
That said, investors may want to consider broadening the role of diversifying asset classes within their portfolios. This includes alternatives and real assets, which can help create a more resilient portfolio. In this commentary, we explore the reasons behind this suggestion.
Amid all the market noise, long-term investors are usually best served by remaining invested, diversified, and disciplined. This month’s analysis delves into each of these core principles, and we hope you find it insightful and valuable.
It’s Election Season. Which Factors Drive Returns?
By Rusty Vanneman, CFA, CMT, BFA, Chief Investment Strategist
As election season heats up, many long-term investors naturally wonder which candidate will be better for stock market returns in the years ahead. But is this the best question for long-term investors to focus on?
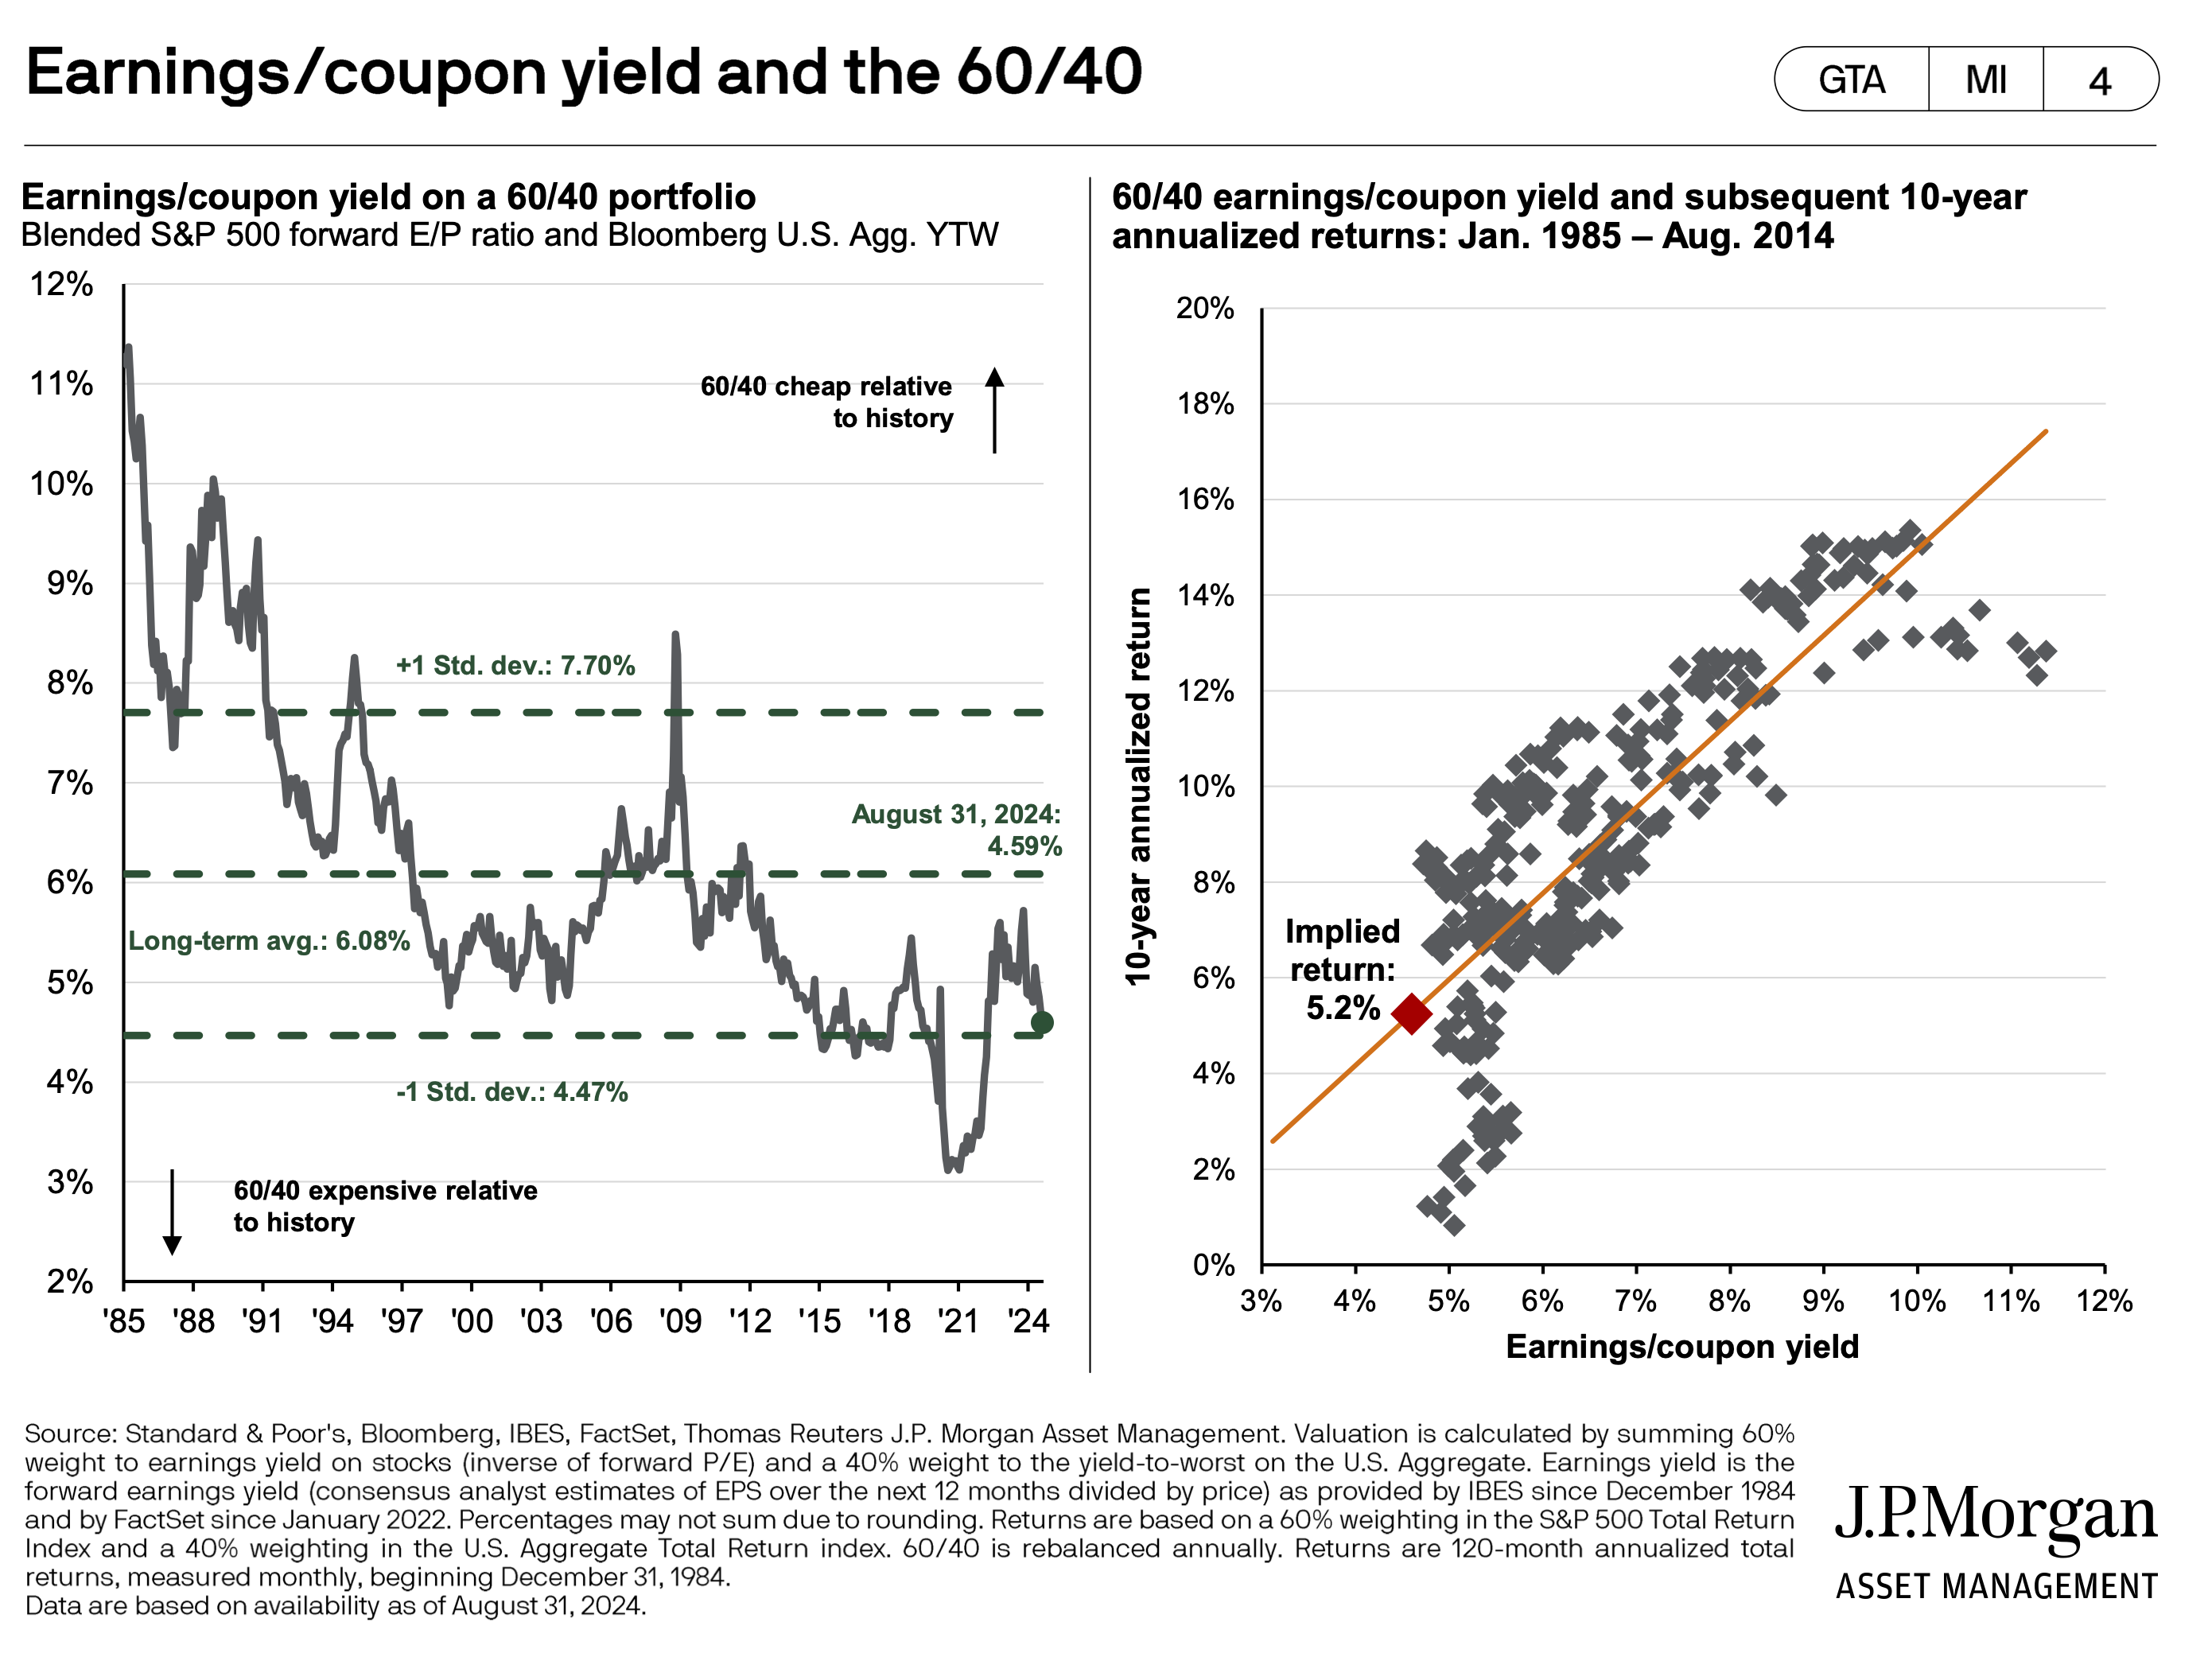
While the stock market does follow earnings over time, successful long-term investing depends significantly on how much an investor pays for those earnings. When valuations are too high — meaning an investor is paying too much for a unit of fundamental value like revenue or earnings — it can hinder long-term returns. However, when valuations are low, it can set the stage for above-average returns and even offer a "margin of safety" if fundamentals underwhelm.
Despite numerous studies showing that one political party may outperform the other in the stock market, other factors, such as earnings and valuations, provide better insight into potential future returns.
Let us look at valuations. When valuations are high heading into an election, returns tend to be below average over the next four years, regardless of which party wins. Conversely, when valuations are low, returns tend to be above average, again, regardless of the election’s outcome.
Research by Nolan Mauk at Brinker Capital examined presidential elections dating back to 1900, using the CAPE Ratio (often also known as the Shiller price/earnings ratio) as a valuation measure. The CAPE ratio, which averages real (i.e., Inflation-adjusted) earnings per share over a 10-year period to smooth out cyclical fluctuations, has indeed shown a negative correlation with future S&P 500 returns, particularly in election years.
Mauk’s findings suggest:
- When the CAPE ratio is in its lowest quintile (indicating the market is most undervalued) during the fourth quarter of an election year, the subsequent four-year average annualized gain has been 15%.
- On the other hand, when the CAPE ratio is in its highest quintile (indicating the market is most overvalued), the following four years have seen an average annualized return of -1%.
- Interestingly, the S&P 500 tends to perform well in the first year of a new presidency when valuations are extended but often under-performs thereafter.
CAPE Quintiles
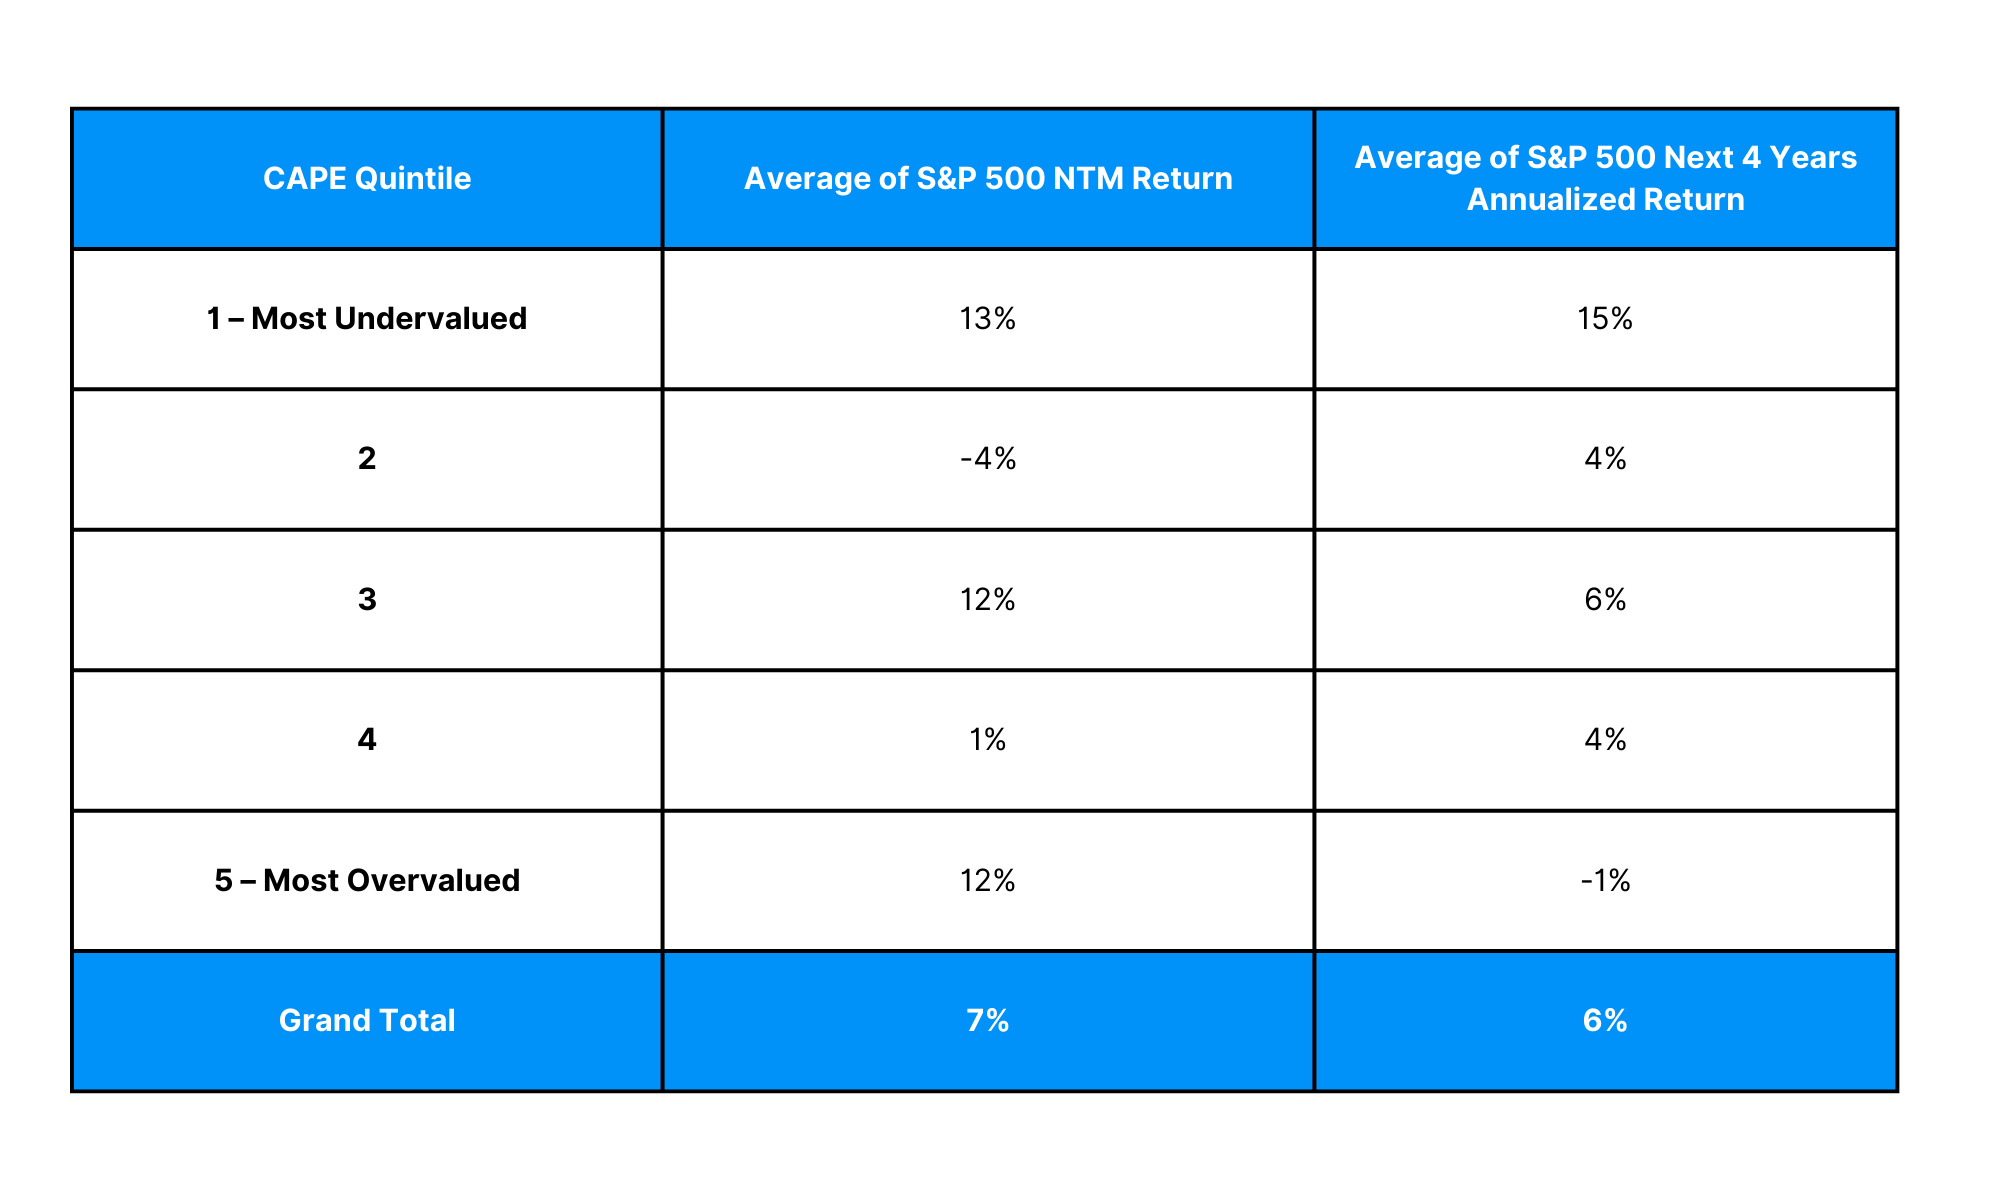
Average of S&P 500 NTM Return is the average return of the S&P 500 over the 12 months following the fourth quarter of an election year. Average of S&P 500 Next 4 Years Annualized Return is the average return of the S&P 500 over the following 4 years (the next presidential term).
This highlights that starting valuations play a crucial role in shaping long-term return expectations, and this holds true in all market environments—not just during election years. The evidence indicates that valuations, rather than election outcomes, are often a more reliable factor for investors to consider when projecting stock market performance, even during election years.
So, where do we stand today? Current valuations place the market in the top quintile, which implies below-average, though still positive, returns in the coming years. It is important to note, however, that the overall market is heavily influenced by a handful of large companies, and concentration in the market is at historic levels.
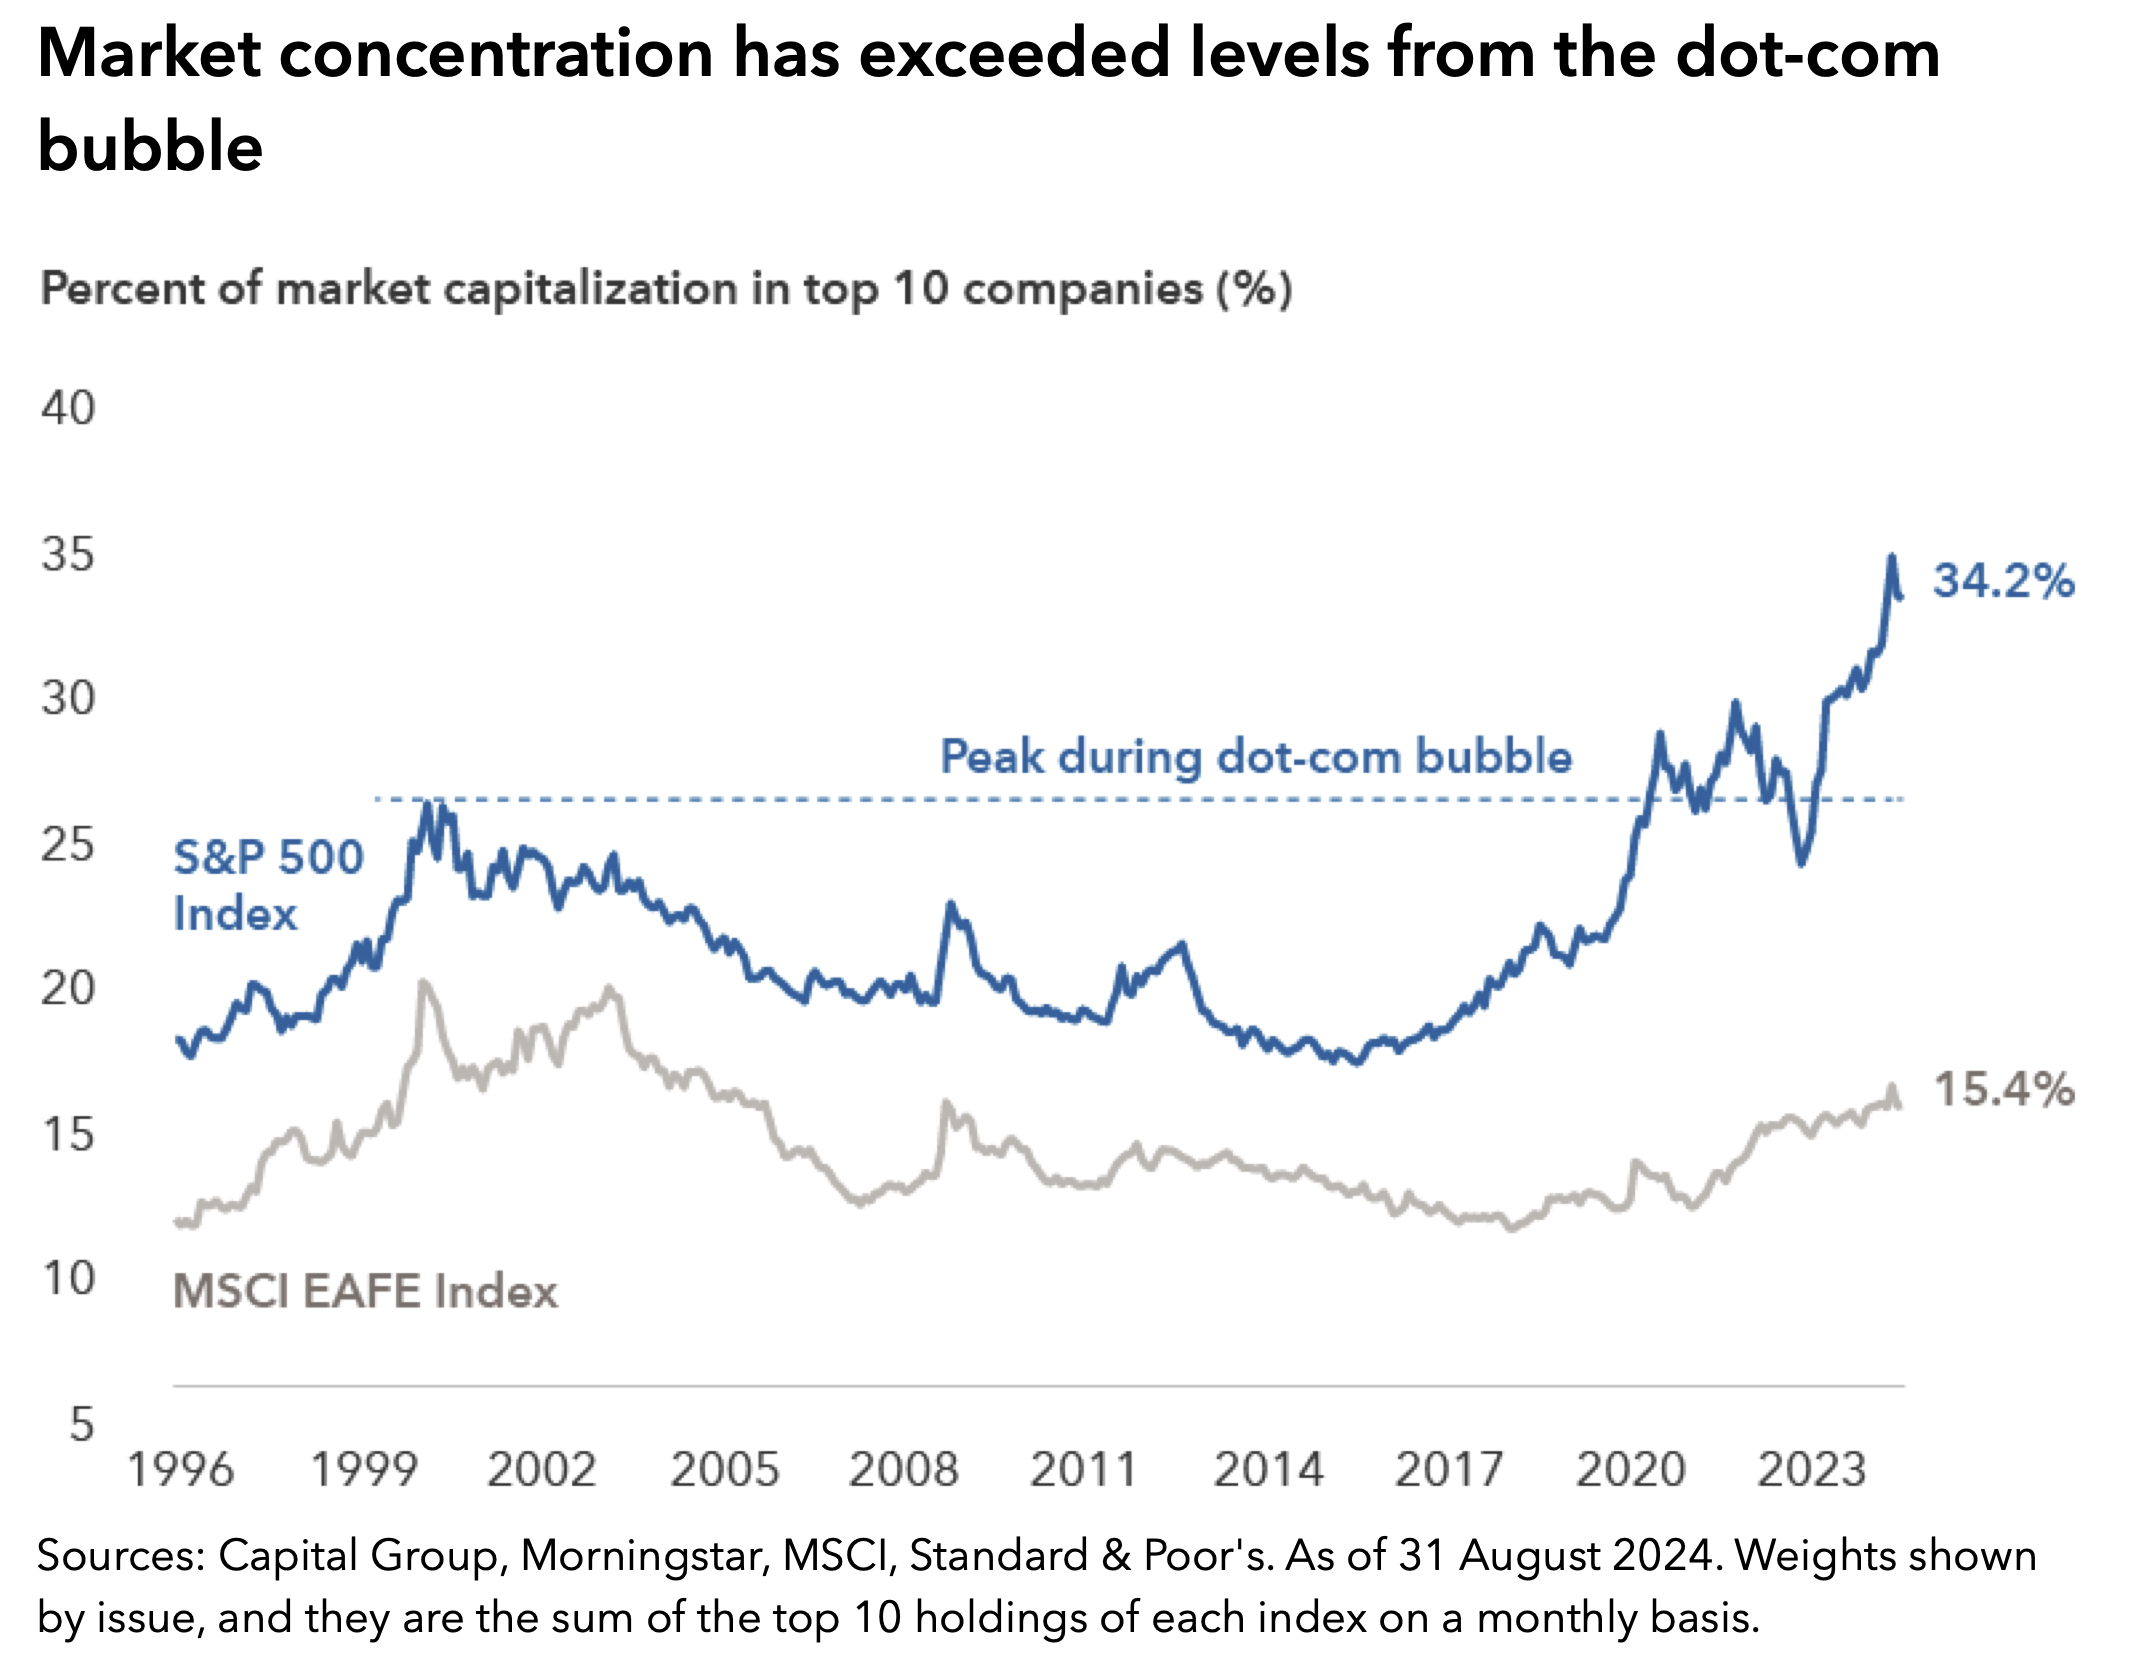
Source: Capital Group.
Many of these top firms dominating the market today are raising the overall market valuation. Take these names out, and we believe there are still attractive areas within the U.S. stock market. For instance, small caps, which have averaged a 20% discount to the broader market since 2000, are now closer to a 50% discount.
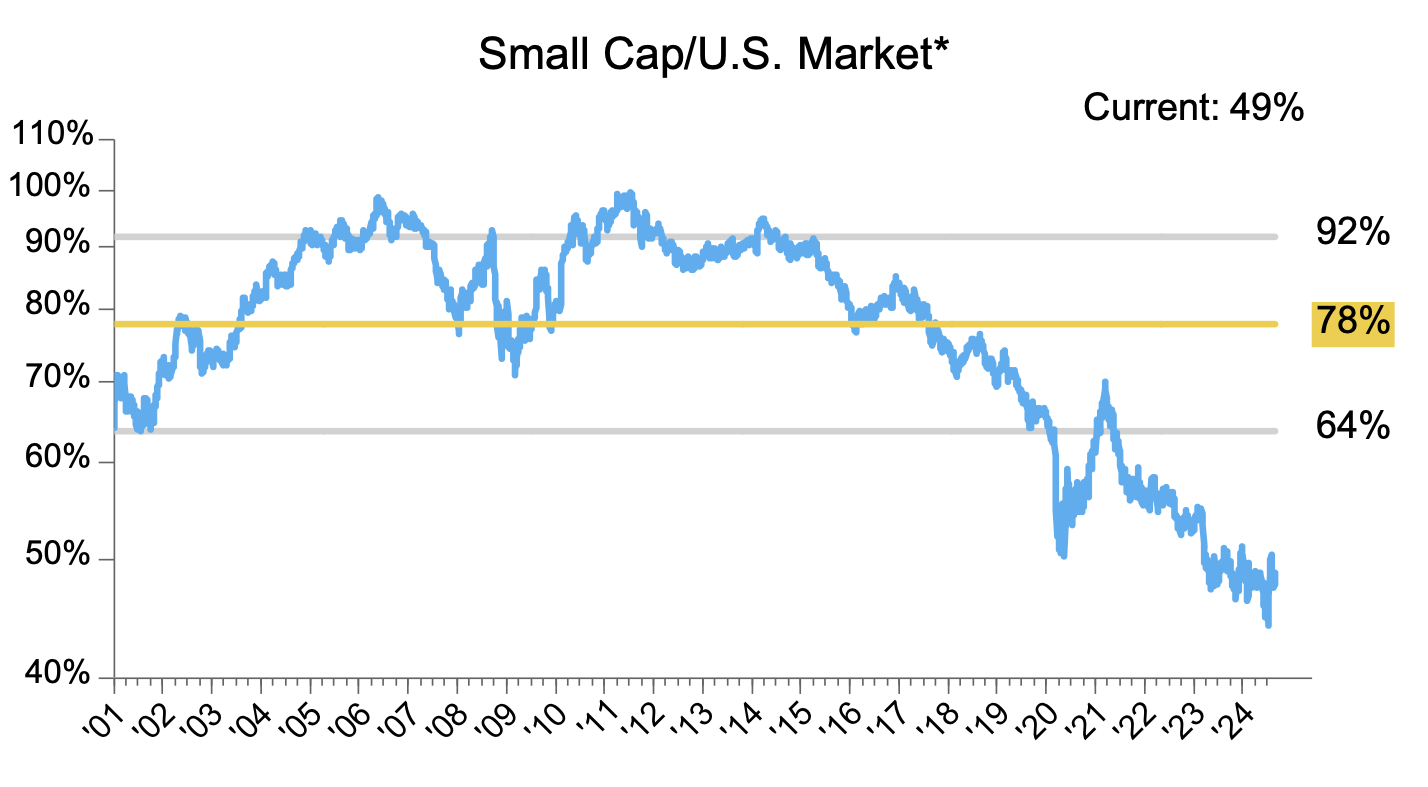
*ETFs used where index data is unavailable. Source: FactSet.
Looking beyond U.S. borders, international markets are also offering value. Developed international markets, which have historically traded at an average discount of around 30% to the US market since 2000, are now at a 45% discount.
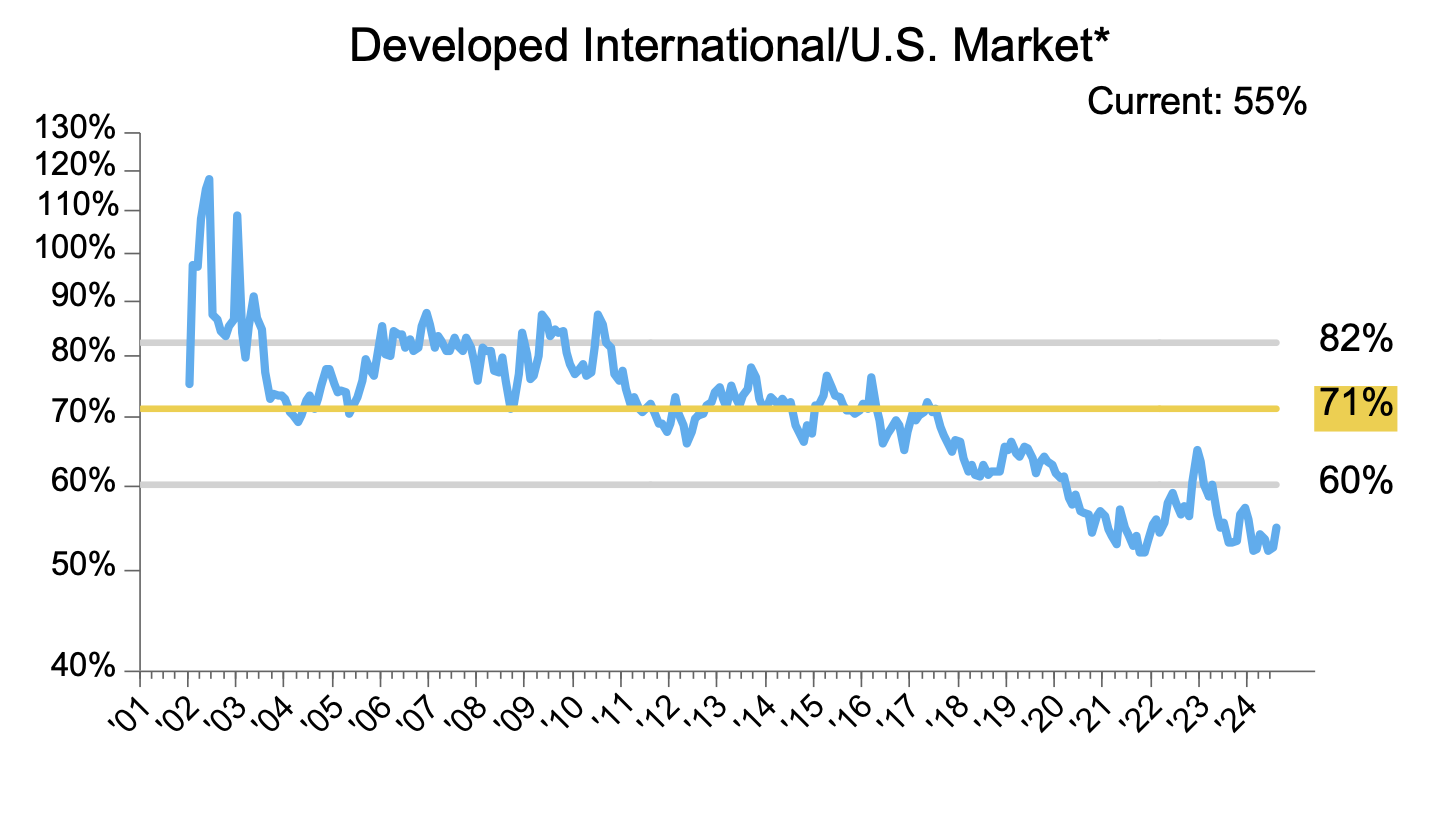
*ETFs used where index data is unavailable. Source: FactSet.
In conclusion, long-term investors may want to avoid placing too much emphasis on who will win the election when considering stock market expectations. Regardless of the election’s outcome, we believe the overall U.S. market is likely to deliver below-average returns over the next four years. However, most investors should stay invested and maintain diversification, as many global markets are offering attractive opportunities to enhance returns.