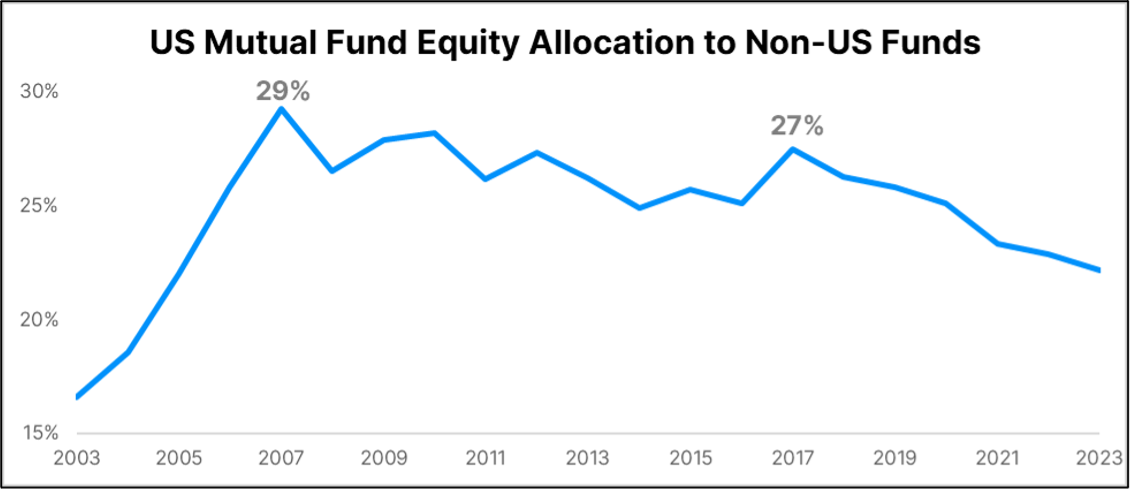
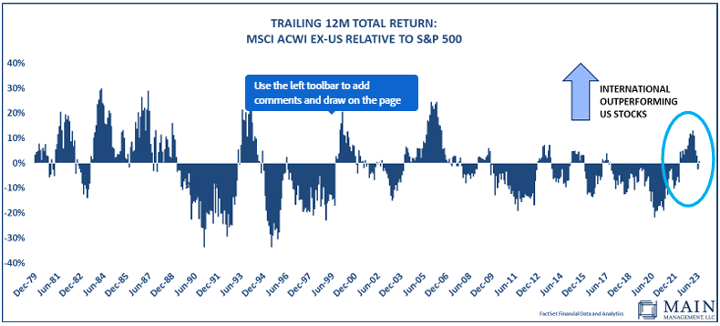
After outperforming domestic equities in 2022 and keeping pace in 2023 (as of October 31), more investors are weighing the viability of international equity allocations in their portfolios. While we believe there is an efficient, real-world approach to including international equities in diversified portfolios, the how, why, and how much remain unanswered questions for many.
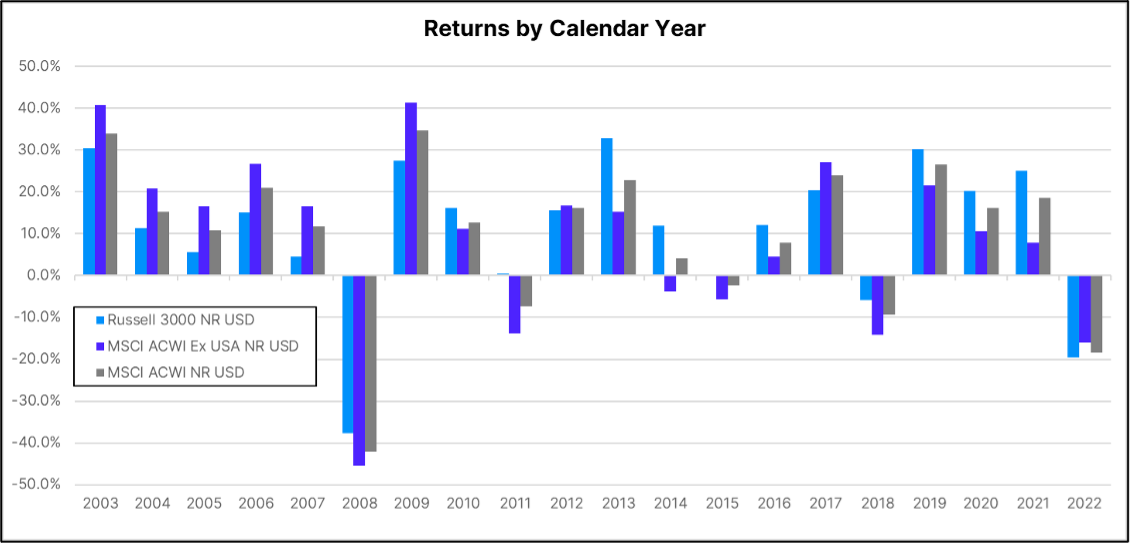
The equity global benchmark is a good starting point for investors to target an appropriate allocation to international stocks. While performance has historically been cyclical between international and domestic equities, we believe that utilizing the broader global investment opportunity set within portfolios has a greater success rate in achieving long-term investor goals.
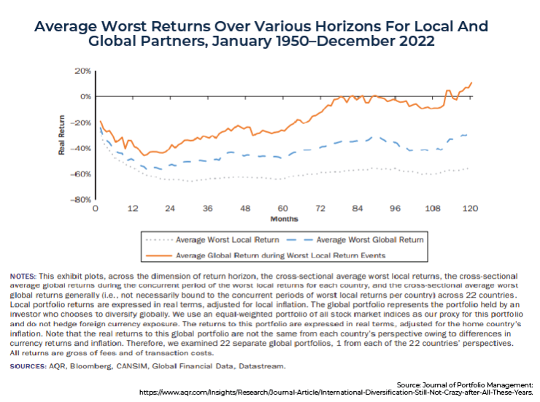
In the sections that follow, we will cover our multifaceted view on allocating to non-U.S. stocks based on both internally produced and third-party partner research. In the end, we hope to adequately portray our view that globally diversified portfolios provide the smoothest path to investor success over time.
Jump to a section below:
Strategic Reasons for International Diversification
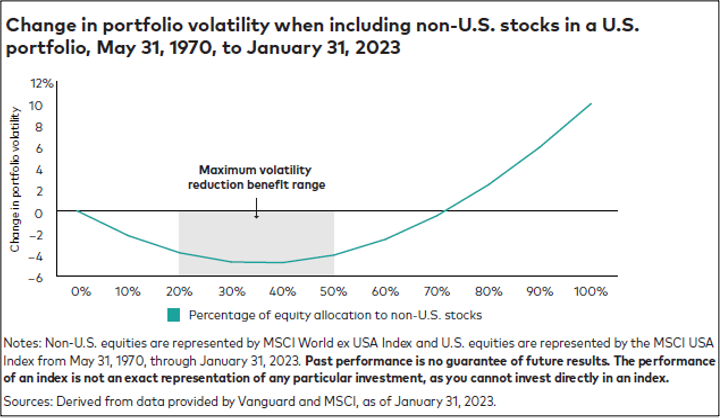
Tactical Reasons for International Diversification
How To Size Your International Position
Let's get started.