What and Who Creates the Behavior Gap? · Why Should Investors Care About Value Investing? · How Should Younger Investors Use Expected Returns? 

Portfolio Advice, Talking Points, and Useful Resources

  • The behavior gap — the difference between an investment's returns and the returns investors actually achieve — has multiple causes, and it’s not entirely the individual investor’s fault.
  • What is value investing, and why should investors care? We outline three key takeaways for investors to consider when building diversified portfolios.
  • How should investors — especially younger ones — think about capital market assumptions, also known as "expected returns"?
     

As we approach the final month of the year, investors are reflecting on several key considerations. First, how should they evaluate their portfolios’ performance this year, and what adjustments should they consider for the year ahead? In this month’s report, we explore three topics that may help guide these assessments. Ultimately, our advice remains consistent: Long-term investors are best served by staying invested, diversified, and disciplined. We hope you find this analysis valuable. If you have any feedback or questions about the material, we encourage you to reach out. 


What and Who Creates the Behavior Gap?

By Rusty Vanneman, CFA, CMT, BFA, Chief Investment Strategist

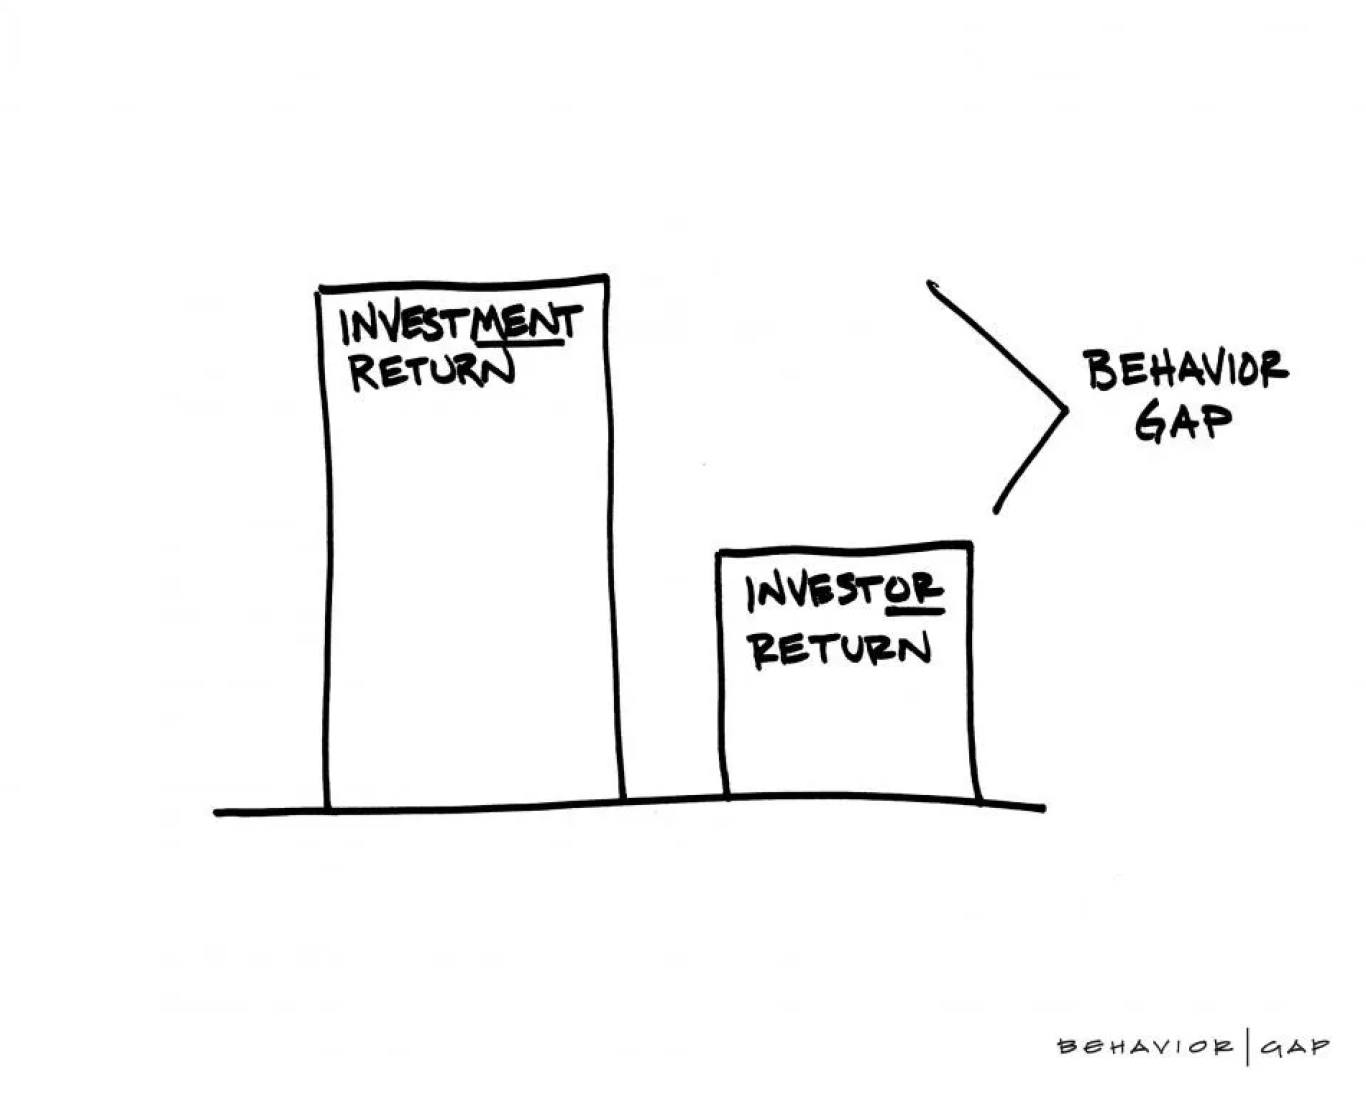
For years, we’ve highlighted one of the most critical issues in investing — arguably the top issue — the behavior gap.


November Monthly Commentary 2024
Source: Carl Richards, OPS Quarterly Reference Guide.


The behavior gap reflects the difference between an investment’s return and the return investors actually experience in that same investment. The disparity is often due to timing — specifically when an investor decides to dive into or pull out of the market based on emotion rather than sound financial planning or economic rationale. This behavior frequently runs counter to an investor’s financial plan. At Orion, we are passionate about addressing this challenge. Whether it’s through insights from our chief behavioral officer, Dr. Daniel Crosby, and his team at Orion Behavioral Finance, or via thought leadership from our investment strategy team, we dedicate ourselves to closing the gap.

What drives suboptimal returns? Often, it’s performance chasing — buying after prices have surged or selling after they’ve dropped. It’s a cycle we’ve all seen play out; yet, it remains one of the most difficult traps to avoid. Numerous studies, listed in our OPS Quarterly Reference Guide, including findings from the Vanguard Advisor’s Alpha study, show that financial advisors deliver value far beyond their fees. Arguably, their greatest contribution is their ability to keep investors balanced, diversified, and aligned with their financial plans.

Why does performance chasing hurt investors? It’s a complex issue, particularly when juxtaposed with the familiar disclaimer, “past performance is not indicative of future results.” To delve deeper, let’s borrow some wisdom from John Rekenthaler’s swan song article, "Do Historical Stock Market Returns Matter?" Rekenthaler, who is retiring soon, has long been a thoughtful voice in our industry, and his final piece provides timeless insights.

  • Losers often become winners, especially when considering longer-term performance. Nobel laureate Richard Thaler and co-author Werner De Bondt, in their seminal paper “Does the Stock Market Overreact?” demonstrated that stock portfolios that underperformed over the previous 36 months tended to outperform moving forward, while past winners lagged. Their research aligns with the legendary value investing principles of Ben Graham: Cheap, unpopular stocks often deliver future outperformance.
     
  • Winners can keep winning, especially in the short term. Narasimhan Jegadeesh and Sheridan Titman’s paper, “Returns to Buying Winners and Selling Losers: Implications for Stock Market Efficiency,” presented a different view. Over shorter periods (three to 12 months), past winners continued to outperform, and past losers underperformed. In essence, the nature of historical returns depends on the timeframe being analyzed.


What does this mean for investors? Here’s the takeaway: Longer-term investors should heed the historical pattern that what outperformed in recent years is likely to underperform in the years ahead. While there’s always a chance that recent winners continue to win, the odds are not in their favor. Think of it like a football team that’s a two-touchdown underdog. They could win, but the probabilities are stacked against them.

For those drawn to short-term trends, it’s best to leave momentum and relative-strength strategies to experienced professionals. These approaches demand rigorous analysis, discipline, and emotional resilience. In other words, it’s a full-time job and best left to those trained and incentivized to manage it with precision.

One last consideration — while individual investors often bear the blame for performance chasing, two other factors deserve scrutiny:

  • The use of illustrative portfolios. Many professionals use three-year performance numbers as a key input when evaluating investments or managers. In my experience, the three-year number is probably the most singularly used input in assessing investment management performance and deciding to buy or sell managers. While it’s a good data point to understand behavior and relative risk, this practice often perpetuates underperformance in returns moving forward, as the studies above show.
     
  • Many professional money managers deserve some of the blame. Even professional money managers aren’t immune to performance-chasing behavior. As John Maynard Keynes famously said, “It is better to fail conventionally than to succeed unconventionally.” Many managers, faced with mortgage and tuition payments, stick with the herd to preserve their paychecks, even when the data suggests otherwise.


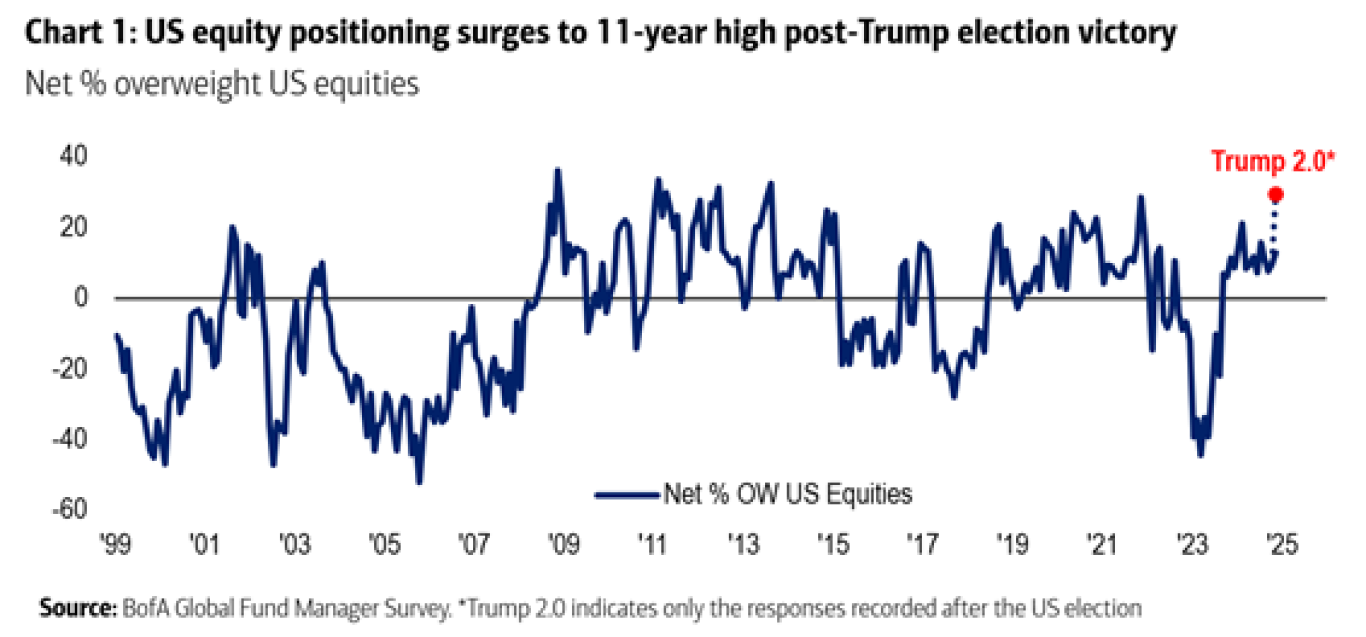
Right now, portfolio managers are the most overweight U.S. equities we’ve seen in more than a decade. This comes after years of outperformance and in one of the most overvalued U.S. markets in history — conditions that historically suggest below-average returns ahead.


November Monthly Commentary 2024
Source: BofA Global Fund Manager Survey. *Trump 2.0 indicates only the responses recorded after the US election.


Bottom line: Closing the behavior gap requires discipline. Whether an investor is investing for themselves or on behalf of others, success hinges on staying true to a financial plan and investment mandate. The road isn’t always easy, but with a steady hand and a long-term perspective, it’s a journey worth taking.


Get Your Own Market Commentary

Client-Friendly Weekly Wire

Want a version of Weekly Wire you can send directly to your clients? Subscribe to our Weekly Wire newsletter and get a client-friendly version every Monday. Simply download, add your firm's logo, and use with your clients!


What is Value Investing, and Why Should Investors Care?

By Rusty Vanneman, CFA, CMT Chief Investment Strategist

Value investing has long captivated investors by tapping into a simple yet powerful concept: buying something on sale. The idea is that purchasing companies at a discount should intuitively lead to higher returns over time, ideally with lower risk. This dual appeal of better returns and reduced risk is why value investing remains a cornerstone strategy.

Take Warren Buffett, for example. The legendary investor is synonymous with value investing, and his success has inspired countless mutual funds, ETFs, and indices to adopt value-focused strategies. However, not all value investments are created equal. Different interpretations of value can lead to vastly different portfolio constructions and outcomes. That’s why understanding the nuances behind the term is essential for investors.


The Case of Two Value Benchmarks

A perfect illustration of these differences lies in two well-known value benchmarks: the Russell 3000 Value Index and the Morningstar Value Index. Over the past three years (as of Nov. 18, 2024), the Russell 3000 Value Index delivered an annualized return of 7% (compared to 8% for its growth counterpart). Meanwhile, the Morningstar Value Index boasted an annualized return of 11%, while its growth counterpart eked out just 1%. Why such a stark contrast?

The answer lies in how these indices define value.

Russell’s Approach to Value:

  1. Primary Factor: Book-to-price ratio.
  2. Secondary Factors: Future earnings forecasts and historical sales growth.
  3. Scoring System: A composite value score ranks stocks, allowing some to exhibit both value and growth characteristics.
  4. Portfolio Composition: Stocks are assigned proportionally to value and growth indices based on their scores.


Morningstar’s Approach to Value:

  1. Primary Factors: Price-to-book, price-to-sales, and price-to-earnings ratios.
  2. Additional Factors: Cash flow consistency, dividends, and forward earnings estimates.
  3. Fair Value Estimate: Morningstar analysts assess whether a stock trades below its calculated fair value.
  4. Portfolio Composition: Stocks are assigned based on percentile rankings across their value metrics.

Both approaches are valid and reflect disciplined methodologies. However, these differing definitions highlight why value investing isn’t a one-size-fits-all endeavor.


Three Key Takeaways for Investors

1. Understand the Starting Point

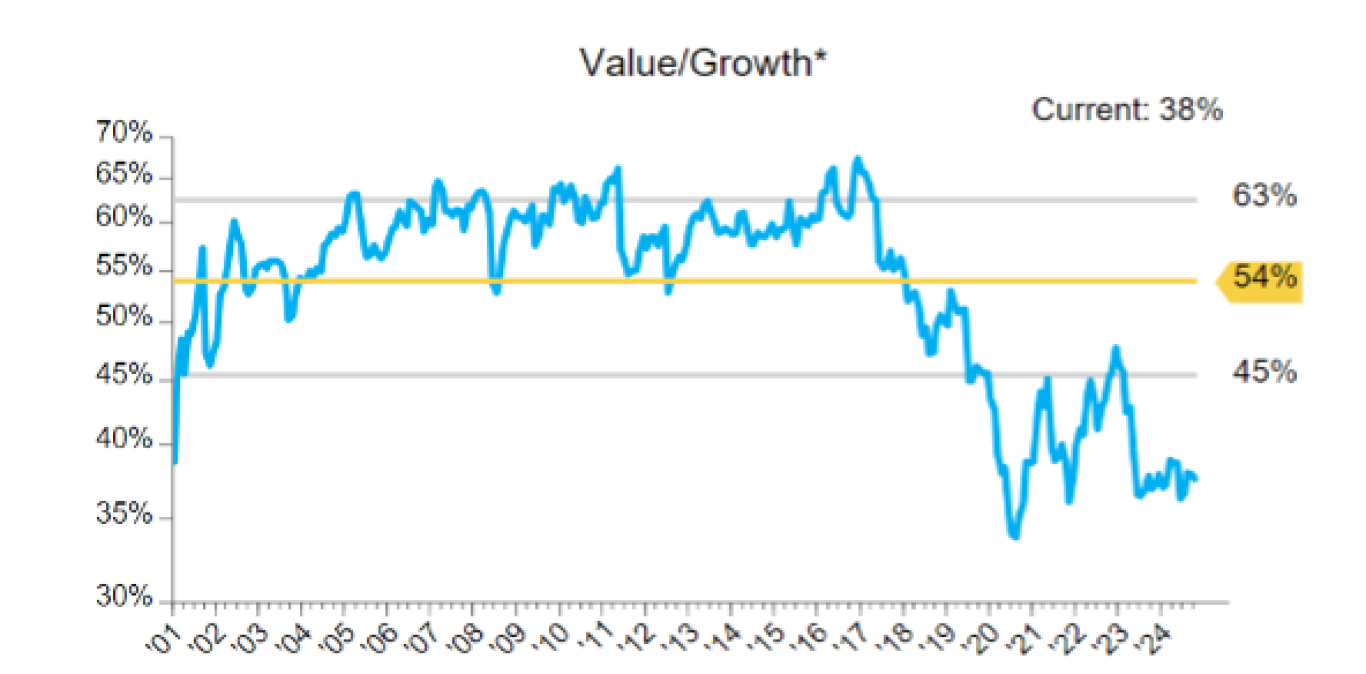
At Orion, we emphasize the importance of starting points in our "Starting Points Matter" chart book, which evaluates asset classes and sectors using a composite valuation index. This index blends metrics such as price-to-book, price-to-sales, price-to-earnings, and price-to-cash-flow ratios.
One striking example: the valuation gap between value and growth stocks. Historically, value stocks trade at about 54% of the valuation of growth stocks. Currently, they’re at just 38% — a steep discount! While recent market trends, such as the rise of the Magnificent Seven, have temporarily tilted the scales, value stocks have been bottoming and improving over the last four years. For investors heavily weighted in growth, this data suggests it might be time to consider rebalancing toward a more diversified allocation.


November Monthly Commentary 2024
Source: Orion Starting Points Matter Monthly Chart Pack.


2. Leave It to the Professionals

Navigating value definitions and metrics can be complex. Professional value managers dedicate their careers to analyzing companies and determining which valuation measures apply in specific scenarios. Their expertise extends beyond a single metric, enabling them to contextualize investments within broader market conditions. For most investors, leveraging this expertise can lead to better outcomes.

3. Focus on Portfolio Construction

Value investing shouldn’t exist in a vacuum. It’s crucial to consider how a value sleeve fits within the broader portfolio. Does it complement existing positions? How does it align with overall risk and return objectives? Professional managers take a holistic view, ensuring that value investments work harmoniously within the portfolio's mandate.

Bottom line: Value investing offers a compelling opportunity for investors seeking returns and diversification. While differing definitions of value might seem confusing, they also provide flexibility to tailor strategies to individual goals. Whether through rebalancing allocations, relying on professional expertise, or optimizing portfolio construction, value investing remains a vital tool in the investor’s toolkit — especially when the sale signs are up!


Capital Market Assumptions and What They Mean for Young Investors

Nolan Mauk, Research Analyst

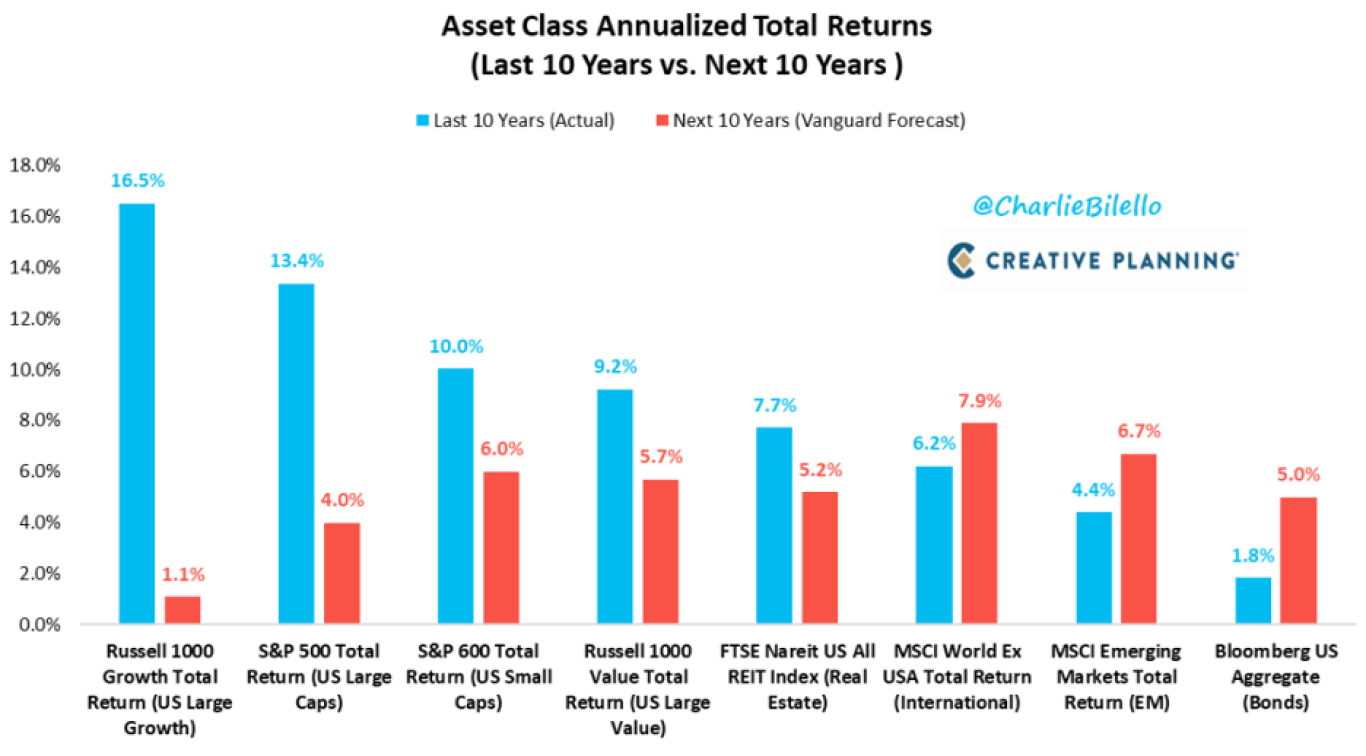
For young professionals and recent college graduates, getting invested is a key priority. Many have heard about the power of compound interest and the wonderful benefits that can come from investing at a young age. Furthermore, since young investors tend to have the longest time horizons, especially in retirement accounts, they’re able to pursue more aggressive investment strategies. For many, that could mean buying the S&P 500, Nasdaq, or other U.S. stock indexes, and for the past decade, that strategy has paid off greatly. The U.S. has outperformed international markets, large caps have outperformed small caps, and growth has outperformed value, all contributing to strong performance from large, tech-heavy U.S. stock indexes.

However, many large banks and investment companies do not expect these trends to continue into the next decade. This graph compares the last 10 years’ returns (blue) with Vanguard’s forecasts for the next 10 years (red):


November Monthly Commentary 2024
Source: Charlie Bilello, Creative Planning.
 

Vanguard is not the only bear when it comes to long-term U.S. stock performance. Most long-term capital market assumptions are expecting U.S. equities to return 4-7% per annum over the next 10 years, value to outperform growth, and small caps to outperform large caps. Basically, they’re expecting reversions to the means of recent trends. In a more extreme case, Research Affiliates is currently projecting U.S. large-cap stocks to return 3.3% per year over the next decade, which is lower than its projection for cash (3.6%)!

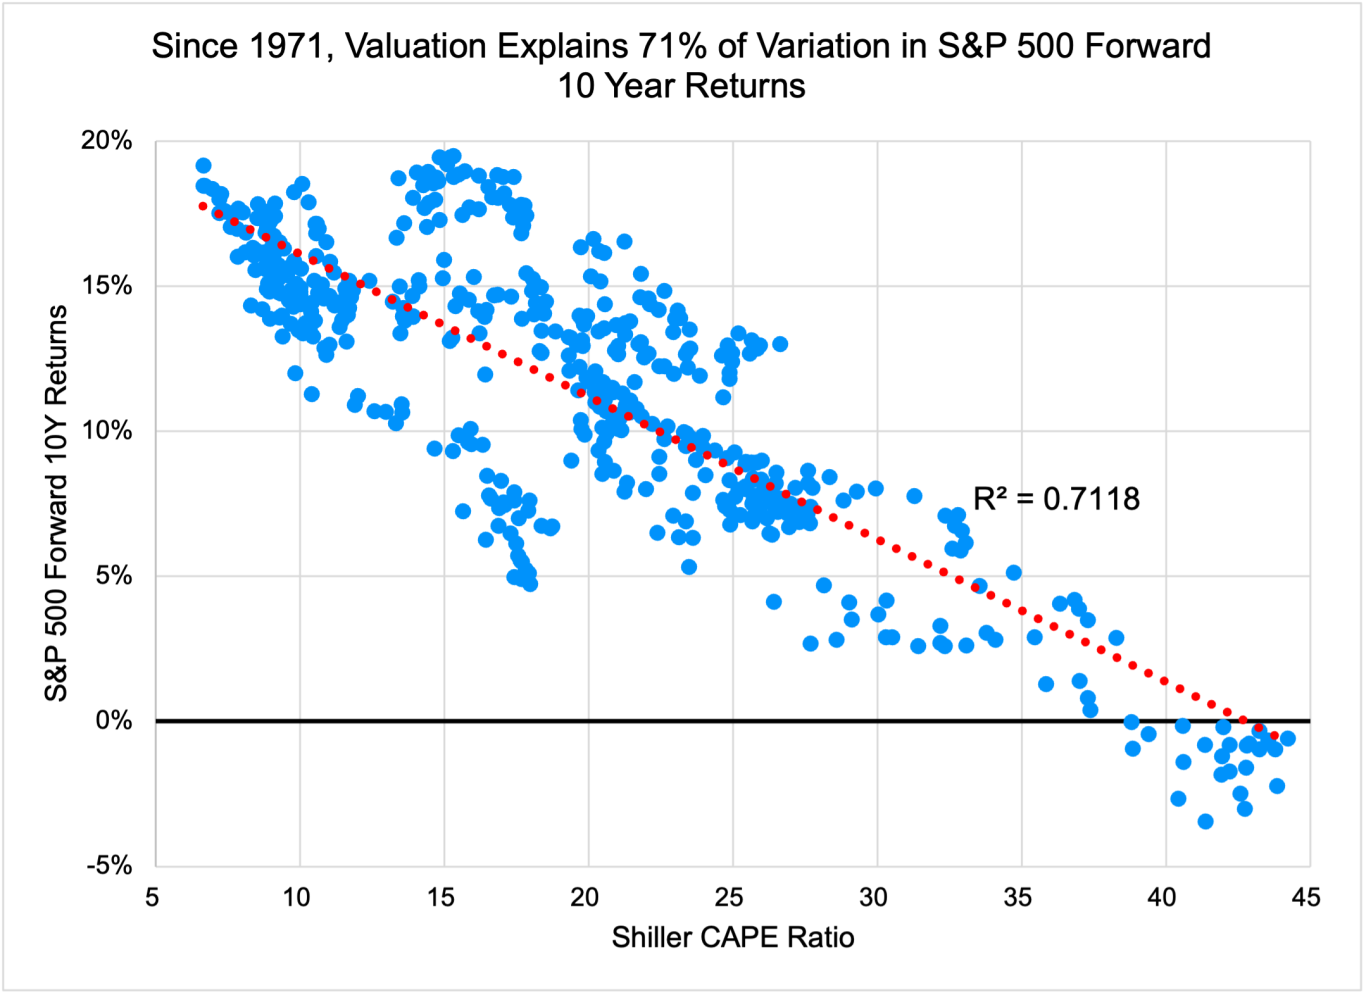
So, why is everyone so bearish on the U.S. over the next decade? While dozens of factors and intensive research go into these predictions, long-term projections tend to rely heavily on valuations. While they have little effect on short-term performance, valuations have explained 71% of the variations in the forward 10-year returns of the S&P 500 since 1971, giving further merit to the famous quote from Benjamin Graham, which also happens to be the inspiration behind the name of Rusty’s podcast, Orion’s The Weighing Machine: “In the short run, the market is a voting machine, but in the long run, it is a weighing machine.”


November Monthly Commentary 2024
Source: Valuation measure is Yale Professor of Economics Robert Shiller’s cyclical price-to-earnings (CAPE) ratio. S&P 500 returns are from Morningstar Direct and span from 1/1/1971 – 10/31/2024.


This relationship and current valuation levels are the basis of the bearish sentiment toward U.S. stocks. As of Nov. 1, the cyclically adjusted price-to-earnings (CAPE) ratio of the S&P 500 was 38.1, falling in the 98th percentile of CAPE ratios dating back to 1881. Outside of recent months, the stock market has only been this expensive once before — in the peak of the dot-com bubble in the late 1990s.

Capital market assumptions should be taken for what they are: assumptions, not facts. But given the tumultuous outlook on U.S. stocks, younger and more aggressive investors may be rethinking a U.S. large-cap-focused investment strategy for the intermediate to long term and looking for ways to diversify. Fortunately, there are many attractive pockets of the global financial markets beyond low-risk investments such as fixed income. Young investors may want to look to international developed and emerging markets, small caps, and alternatives, which are all viewed more favorably across capital market assumptions, as ways to broaden out a home-biased portfolio to continue seeking riskier investments with higher expected returns throughout the coming market cycles.

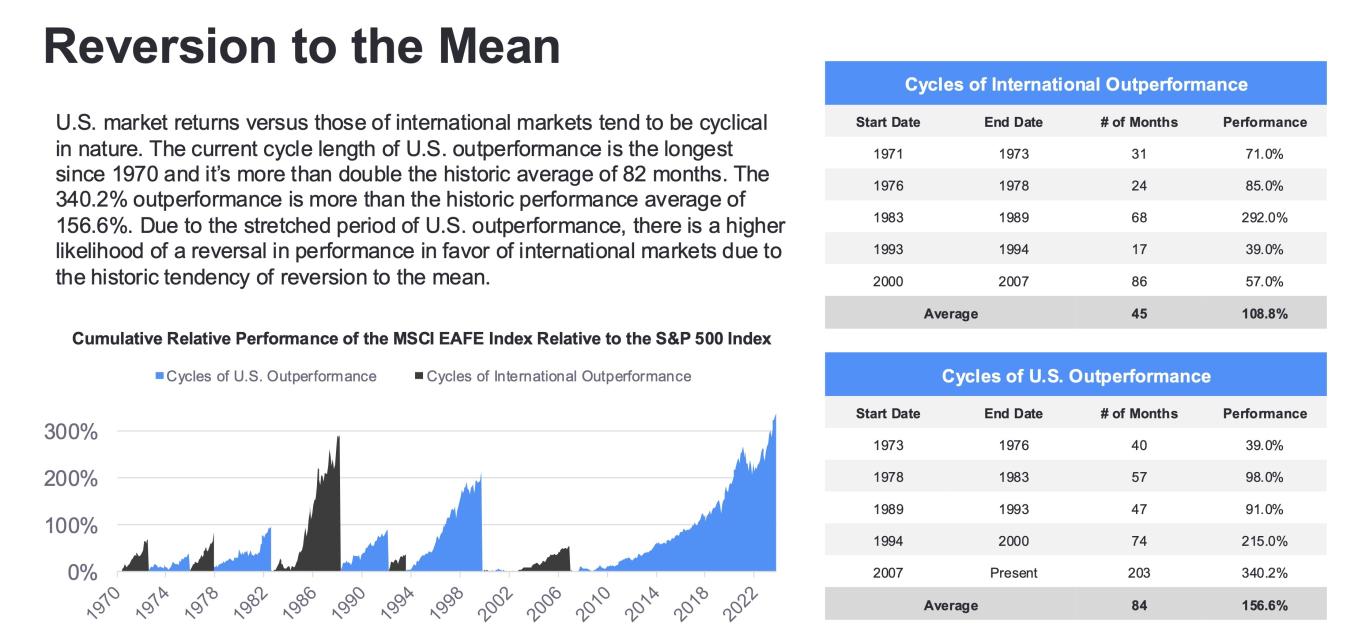
The valuation argument works in favor of other asset classes in the same way it works against the U.S. For example, since 2001, international stocks have traded at about a 23% discount to U.S. stocks. Today, they’re trading at a 49% discount. As this slide from the Q4 OPS Reference Guide shows, cycles of outperformance between the U.S. and international stocks tend to last for years before reverting, and we’re currently in the longest and strongest cycle of U.S. outperformance in recent history. If valuations truly do well to explain forward 10-year returns, we may be about to see a reversion in the coming decade.


November Monthly Commentary 2024
Source: Morningstar Direct data from 1/1/1970 to 9/30/2024.


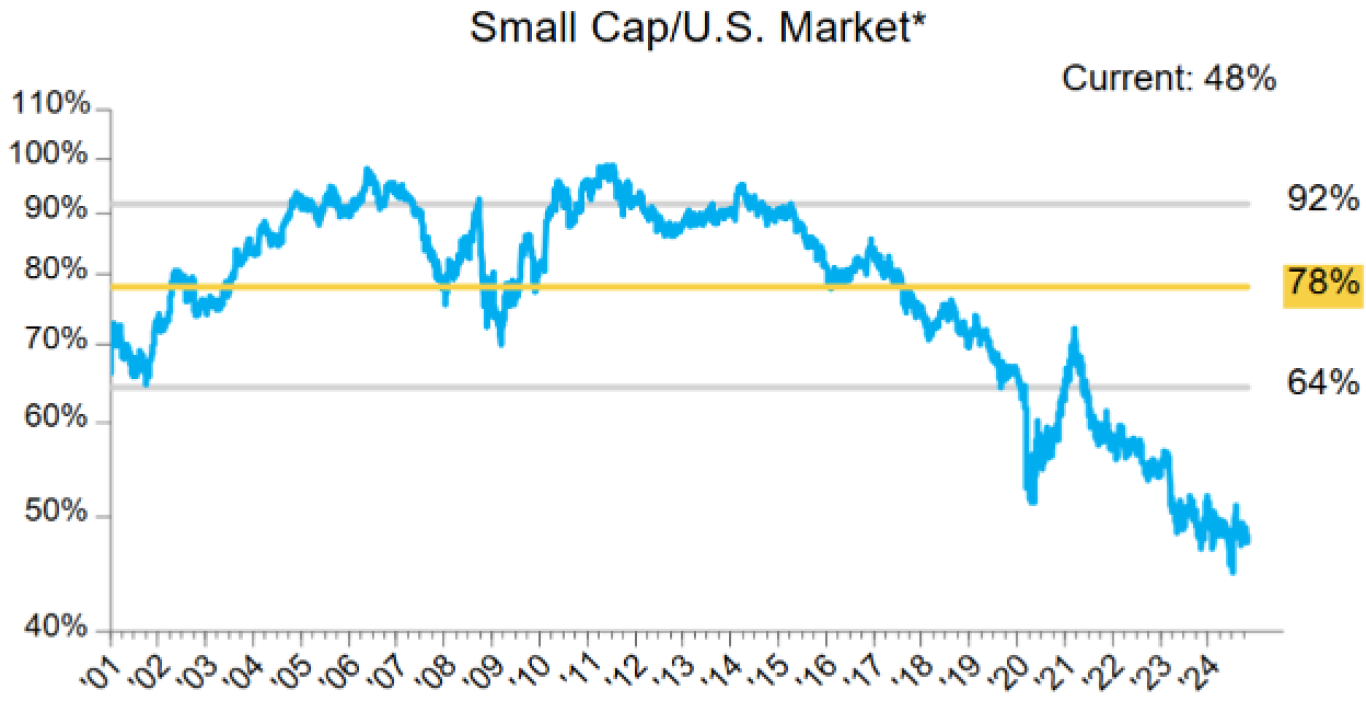
The same can be said for small caps, which are trading at a massive discount relative to historical returns.


November Monthly Commentary 2024
Source: Orion Starting Points Matter Monthly Chart Pack.


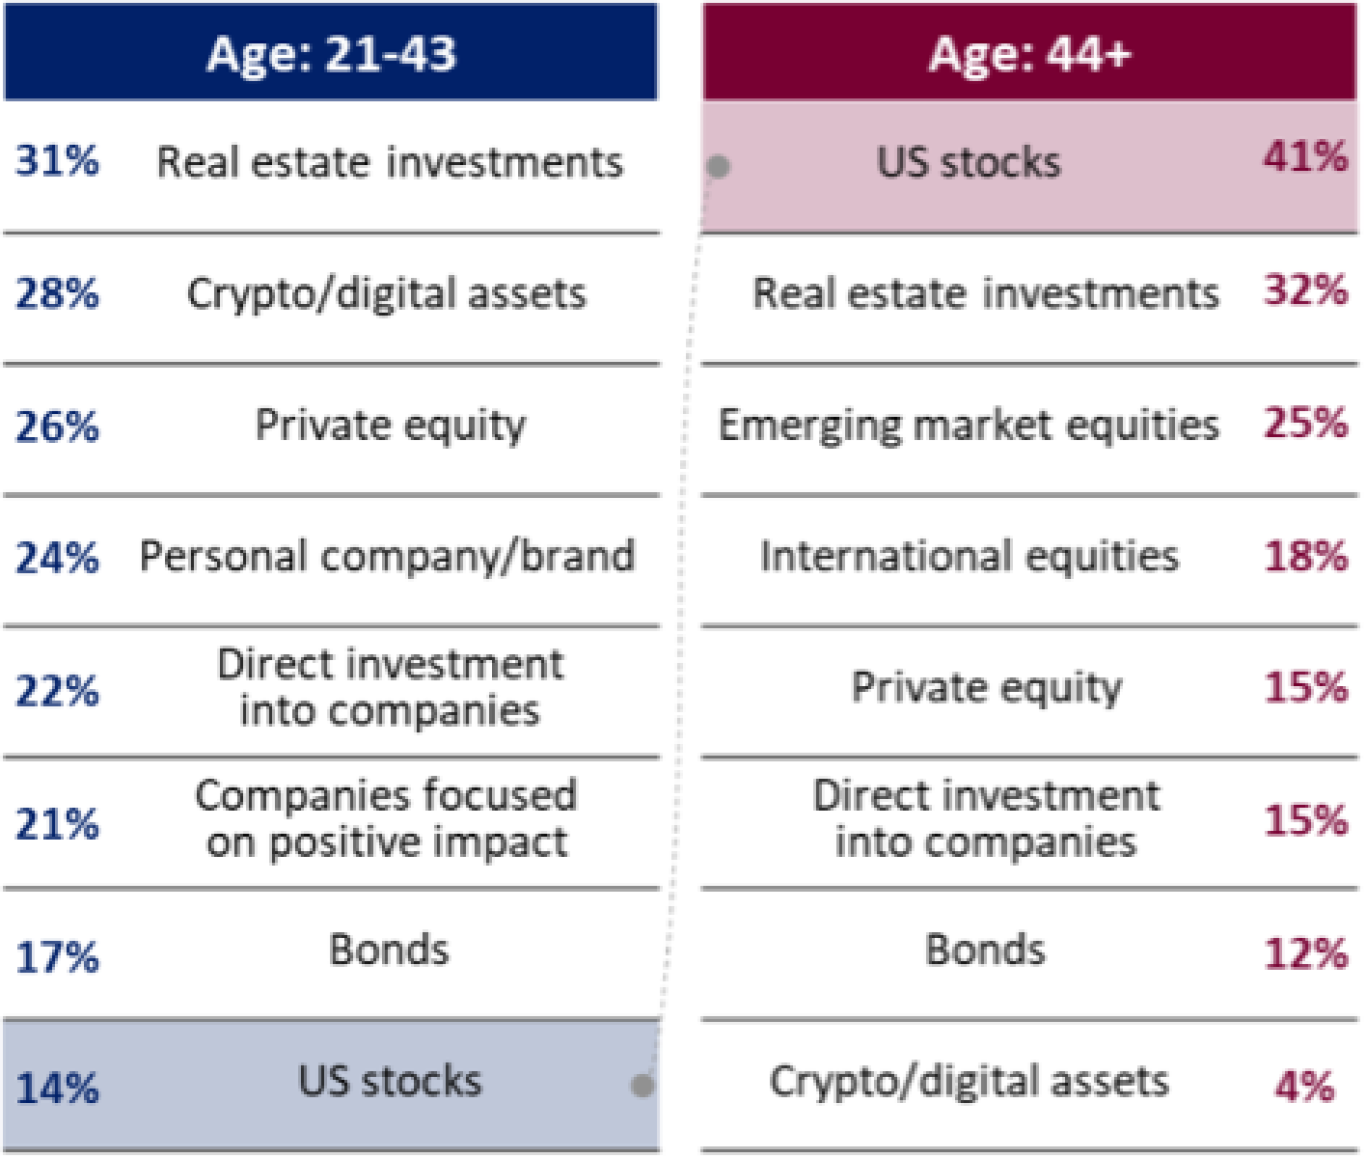
Additionally, wealthier young professionals are increasingly turning to alternative investments. According to CNBC, “nearly one-third of young, wealthy investors’ portfolios are in alternative investments like hedge funds, private equity, and crypto and digital assets.” A fascinating study by Bank of America asked investors in different age groups to rank major asset classes based on where they see the greatest opportunities for growth. Here’s how they responded:


November Monthly Commentary 2024
Source: Bank of America.


It seems young people have an appetite for alternatives, especially higher-volatility alternatives, and less of an appetite for U.S. stocks. It will be important for advisors and money managers to adapt to these trends as a new generation of investors enters the market. Cliff Asness of AQR Capital Management argues in his recent article, “In Praise of High-Volatility Alternatives,” that volatile alternatives with low correlations to traditional markets can actually increase a portfolio’s expected return without requiring significant allocations, making them “capital efficient.” Asness emphasizes the importance of diligence and persistence when investing in high-volatility alternatives because, as the name suggests, returns can vary greatly throughout market cycles.

U.S. stocks are unlikely to repeat the success of the last decade over the one that follows. For young, aggressive investors, international stocks, small caps, and high-volatility alternatives are currently attractive and may help investors enhance returns over the next decade when sized correctly in a diversified portfolio.


Thank You for Letting Us Serve You

Thank you for your time and trust. If you have any questions or feedback, please let us know. As always:


Stay invested, stay diversified, and stay disciplined.


Invest well and be well,

Rusty Vanneman, CFA, CMT, BFA
Chief Investment Strategist


More Market Commentary

Want More Resources?

Unlock a wealth of market commentary resources from Rusty Vanneman, Chief Investment Strategist, and the rest of the Investments team.

*ETFs used where index data is unavailable.
Orion Portfolio Solutions, LLC, an Orion Company, is a registered investment advisor. 
This material does not constitute any representation as to the suitability or appropriateness of any security, financial product or instrument. There is no guarantee that investment in any program or strategy discussed herein will be profitable or will not incur loss. This information is prepared for general information only. Individual client accounts may vary. It does not have regard to the specific investment objectives, financial situation, and the particular needs of any specific person who may receive this report. Investors should seek financial advice regarding the appropriateness of investing in any security or investment strategy discussed and should understand that statements regarding future prospects may not be realized. Investors should note that security values may fluctuate and that each security’s price or value may rise or fall. Accordingly, investors may receive back less than originally invested. Past performance is not a guide to future performance. Investing in any security involves certain non-diversifiable risks including, but not limited to, market risk, interest-rate risk, inflation risk, and event risk. These risks are in addition to any specific, or diversifiable, risks associated with particular investment styles or strategies.
An index is an unmanaged group of stocks considered to be representative of different segments of the stock market in general. You cannot invest directly in an index.
The S&P 500 Index is an unmanaged composite of 500-large capitalization companies. This index is widely used by professional investors as a performance benchmark for large-cap stocks.
The Russell 1000 Index measures the performance of the large-cap segment of the U.S. equity universe. It is a subset of the Russell 3000 Index and includes approximately 1000 of the largest securities based on a combination of their market cap and current index membership.
The S&P SmallCap 600 Index measures the small-cap segment of the U.S. equity market.
The FTSE Nareit U.S. Real Estate Index Series tracks the performance of the U.S. REIT industry at both an industry-wide level and on a sector-by-sector basis.
The MSCI World ex USA Index captures large and mid cap representation across 22 of 23 Developed Markets (DM) countries - excluding the United States. With 816 constituents, the index covers approximately 85% of the free float-adjusted market capitalization in each country.
The MSCI Emerging Markets (or EM) Index is an index which tracks performance of international equity securities in developed countries in Europe, Australia, Asia, and the Far East, excluding the U.S. and Canada.
The Bloomberg Barclays US Aggregate Bond Index measures the performance of the total United States investment-grade bond market.
The Nasdaq Composite Index is an index that follows approximately 5000 stocks that trade on the Nasdaq exchange. It is considered a good benchmark for smaller company stocks.
The Russell 3000 Index is an unmanaged index considered representative of the U.S. stock market. The index is composed of the 3,000 largest U.S. stocks.
The Morningstar US Value Index tracks the performance of stocks with relatively low prices given anticipated per-share earnings, book value, cash flow, sales and dividends.
The CFA is a globally respected, graduate-level investment credential established in 1962 and awarded by CFA Institute — the largest global association of investment professionals. To learn more about the CFA charter, visit www.cfainstitute.org.
The CMT Program demonstrates mastery of a core body of knowledge of investment risk in portfolio management. The Chartered Market Technician® (CMT) designation marks the highest education within the discipline and is the preeminent designation for practitioners of technical analysis worldwide. To learn more about the CMT, visit https://cmtassociation.org/.
Orion Behavioral Finance ("Orion BeFi") is the branding name of various tools and services related to behavioral finance offered by Orion Advisor Solutions, Inc. and its subsidiaries. Orion BeFi tools are crafted to help investors and their financial advisors integrate behavioral psychology research into their investment decisions. Orion BeFi tools and services do not provide investment advice.

Compliance Code: 3 0 1 8, Orion Portfolio Solutions, November 22, 2024